Fig. 3.
Download original image
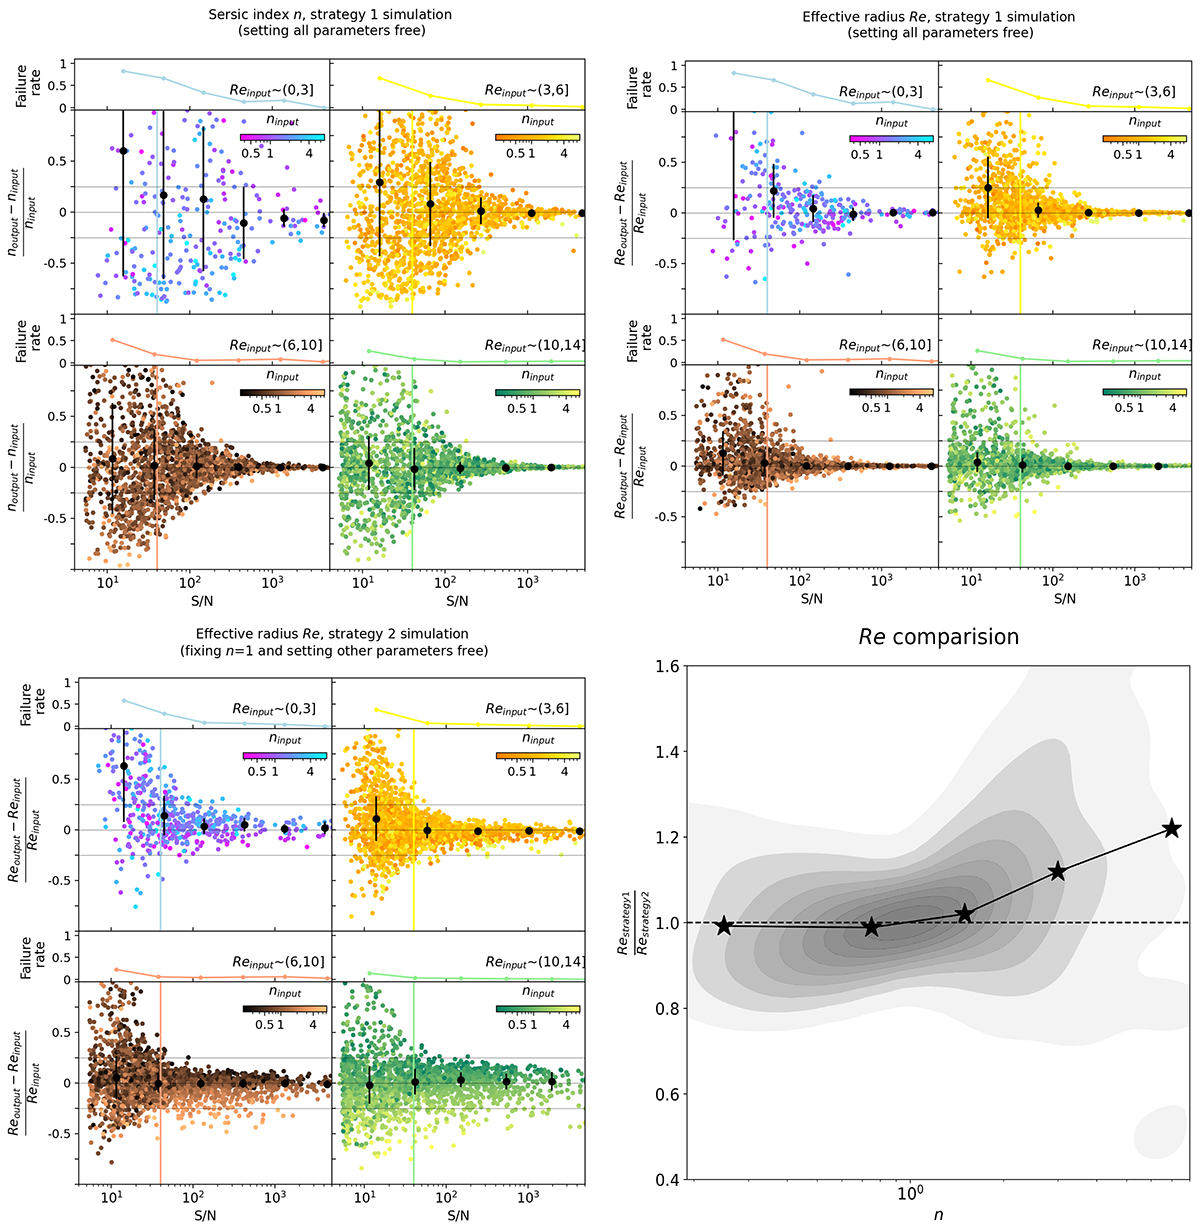
Quality of our fits ([output − input]/input) of the Sérsic index and effective radius vs. input S/N, obtained by fitting 10 000 mock galaxies, for strategy 1 (upper left and upper right panels, fitting all parameters) and strategy 2 (lower left panel, fixing Sérsic index to one). Mock galaxies are split into four different input effective radius bins. Data points are color-coded by their input Sérsic index. Sliding medians and the corresponding uncertainties (16th and 84th percentile) along the S/N are marked by black circles. 25% uncertainties are labeled by horizontal gray lines. Vertical color lines mark S/N of 40 and 10 for strategy 1 and strategy 2, respectively. For each input effective radius bin, the line charts above show the failing rate of GALFIT. In the lower right panel, we compare the ratio between the effective radius of strategy 1 and strategy 2 as a function of the input Sérsic index, with contours exhibiting the distribution and stars showing the sliding median.
Current usage metrics show cumulative count of Article Views (full-text article views including HTML views, PDF and ePub downloads, according to the available data) and Abstracts Views on Vision4Press platform.
Data correspond to usage on the plateform after 2015. The current usage metrics is available 48-96 hours after online publication and is updated daily on week days.
Initial download of the metrics may take a while.