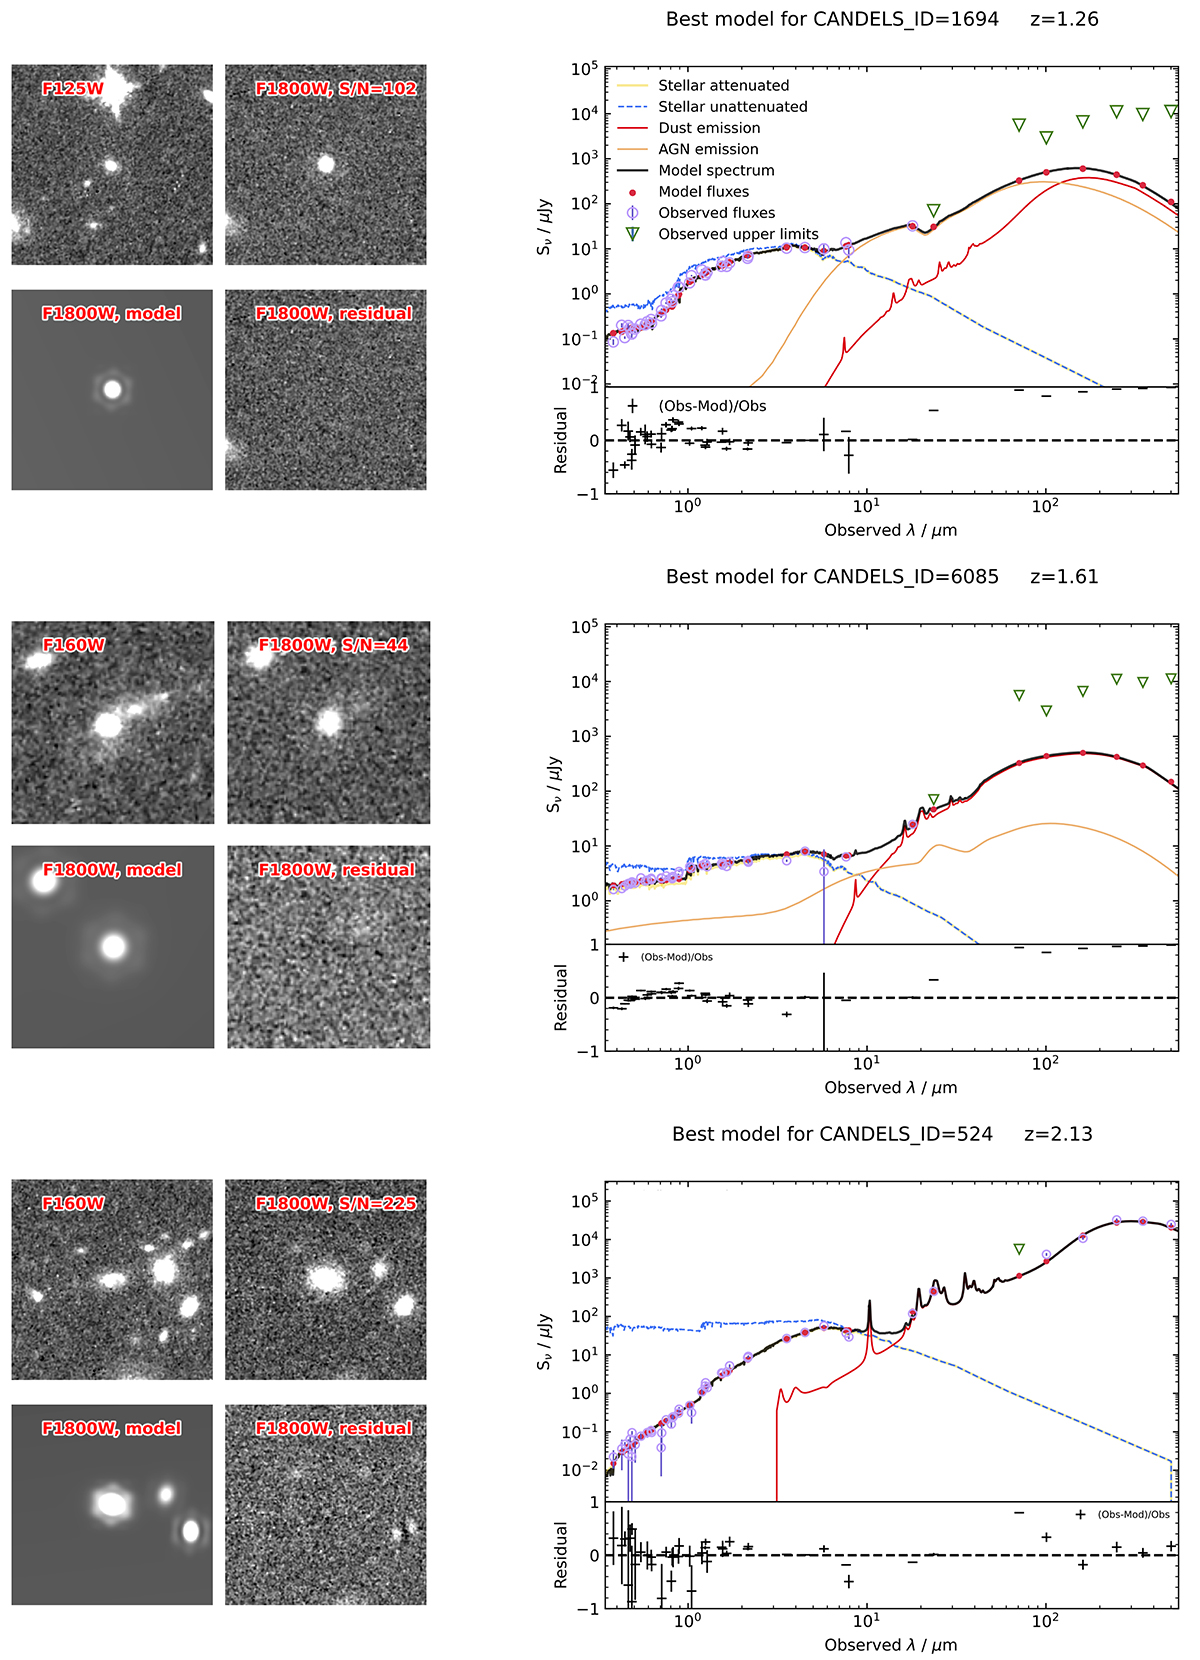
Fig. 2.
Download original image
Left: 10″ × 10″ cutouts of the HST F125W (z < 1.5) or F160W (z > 1.5) and MIRI F1800W images (upper panels), and of the GALFIT model and residual images (lower panels), for three galaxies in our MIRI×CANDELS sample (COSMOS field). Right: Best SED fitting of these galaxies as obtained by CIGALE (Boquien et al. 2019). Blue and red curves are stellar and dust emission; orange curves indicate the emission coming from the AGN component. From top to bottom, the AGN fraction is decreasing, from 70%, to 10%, and then 0%. For galaxies dominated by AGNs, typical PAH features between 3 to 20 μm are hidden by the AGN continuum.
Current usage metrics show cumulative count of Article Views (full-text article views including HTML views, PDF and ePub downloads, according to the available data) and Abstracts Views on Vision4Press platform.
Data correspond to usage on the plateform after 2015. The current usage metrics is available 48-96 hours after online publication and is updated daily on week days.
Initial download of the metrics may take a while.