Open Access
Fig. A.1.
Download original image
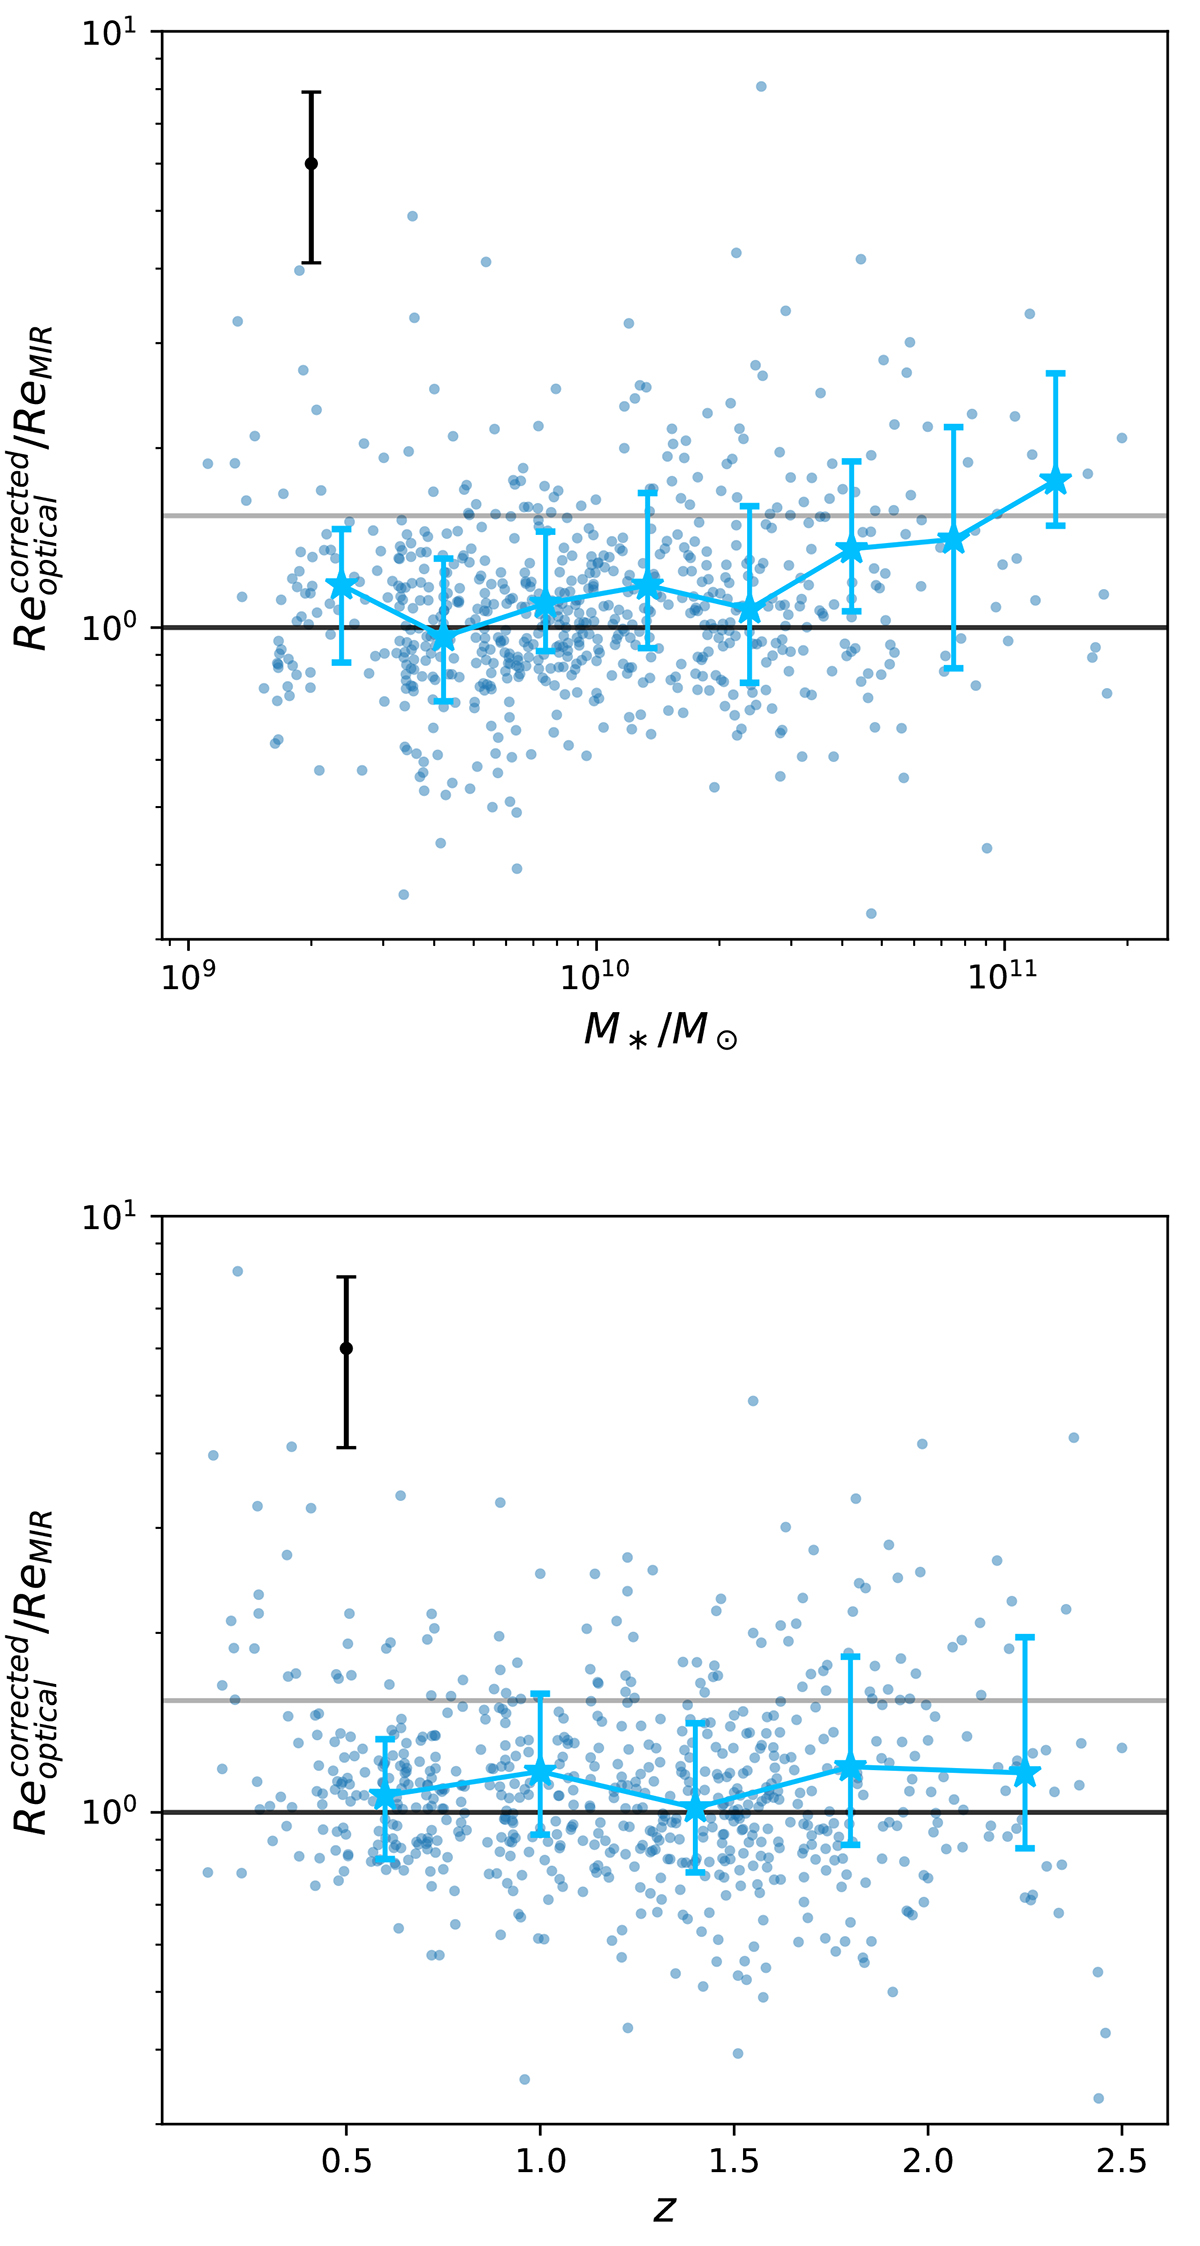
Comparison of stellar mass (top), redshift (bottom) and the ratio between the optical and MIR effective radius of the SFGs in our sample. The black horizontal line shows the ratio of unity and the gray line shows the 2σ threshold as indicated in Fig.14. Blue stars show the corresponding median value.
Current usage metrics show cumulative count of Article Views (full-text article views including HTML views, PDF and ePub downloads, according to the available data) and Abstracts Views on Vision4Press platform.
Data correspond to usage on the plateform after 2015. The current usage metrics is available 48-96 hours after online publication and is updated daily on week days.
Initial download of the metrics may take a while.