Fig. 17.
Download original image
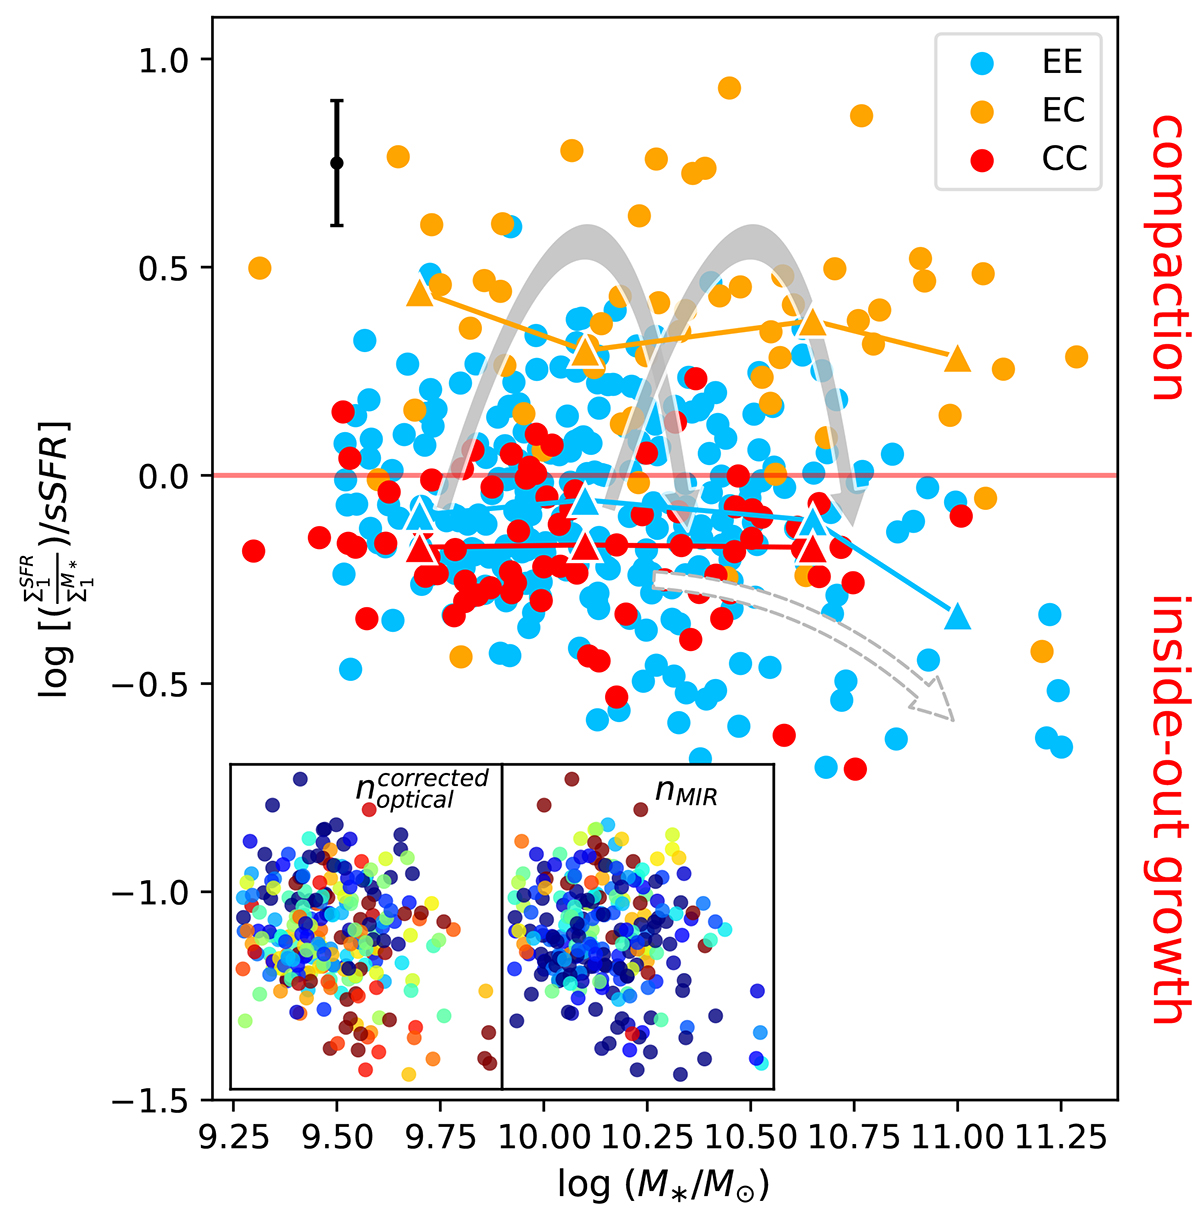
Stellar mass against the ratio of the sSFR measured inside 1 kpc and that measured over the whole galaxy. Red, orange, and blue circles are CC, EC, and EE galaxies, respectively. Median values are labeled by a small triangle. The solid gray arrows depict the scenario in which the secular growth of SFG is interrupted by violent phases of compaction. The dashed arrow illustrates the inside-out quenching for massive SFGs. The two insets show the same distribution, only for EE galaxies color-coded with their optical (left) and MIR (right) Sérsic index (blue: low value; red: high value).
Current usage metrics show cumulative count of Article Views (full-text article views including HTML views, PDF and ePub downloads, according to the available data) and Abstracts Views on Vision4Press platform.
Data correspond to usage on the plateform after 2015. The current usage metrics is available 48-96 hours after online publication and is updated daily on week days.
Initial download of the metrics may take a while.