Fig. 16.
Download original image
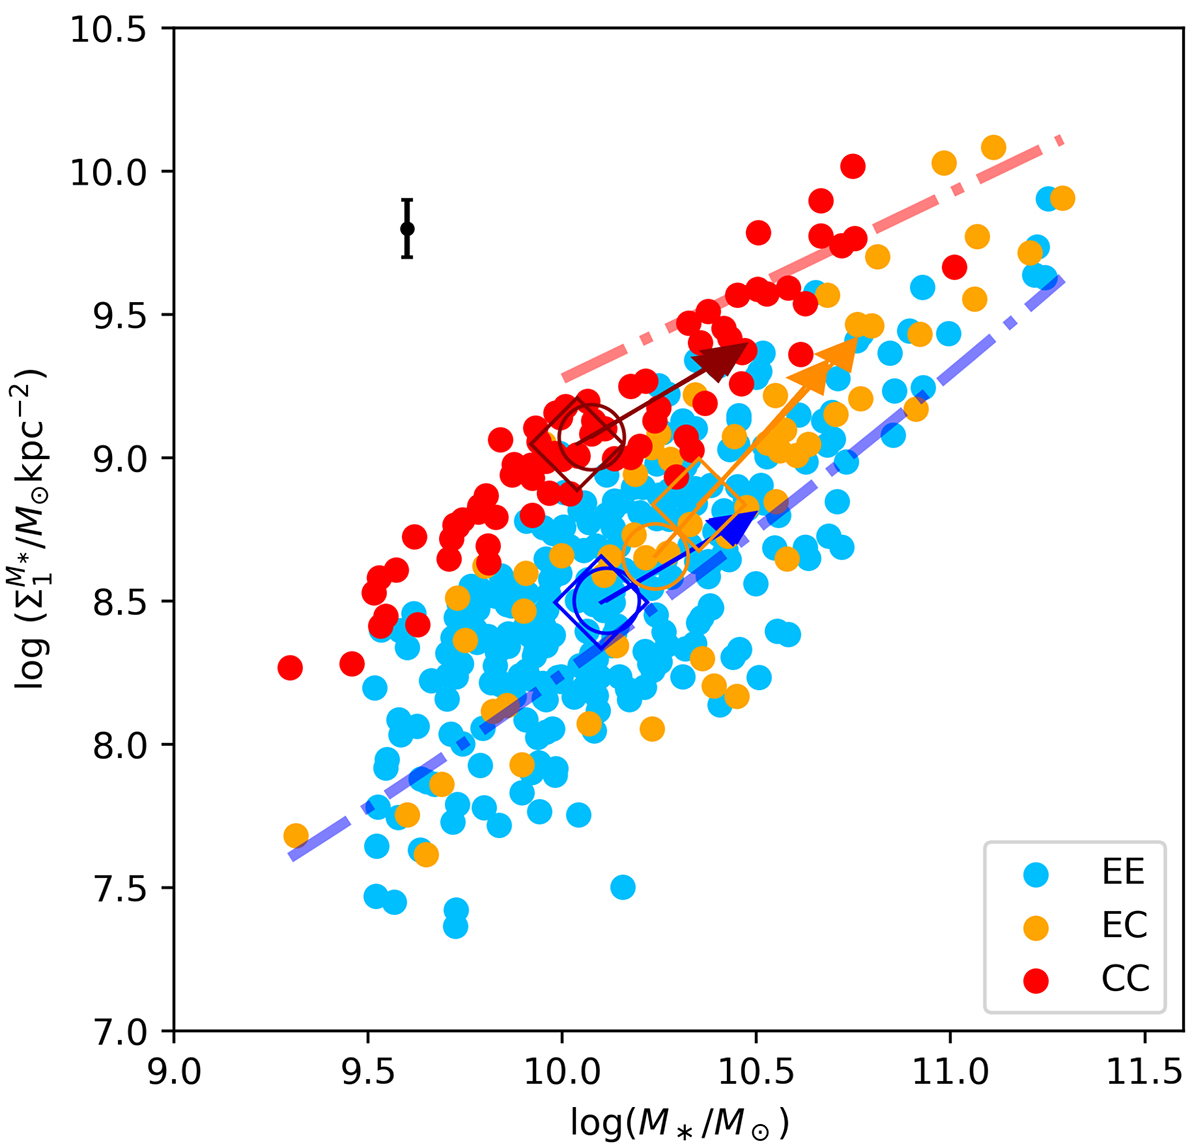
Stellar mass surface density inside 1 kpc versus stellar mass. The red, orange, and blue dots represent CC, EC, and EE galaxies, respectively. The red and blue lines are ![]() –M* relations from Barro et al. (2017) for QGs and SFGs, respectively. Diamonds represents the median value for our three categories of galaxy, and circles are the median value when restricting these galaxies to those with 109.7 < (M*/M⊙) < 1010.7 and z < 2. The arrows show how these median values would evolve in the next 600 Myr by assuming that the SFRs of these galaxies remain constant over this period and that newborn stars follow the light distribution observed in the MIR.
–M* relations from Barro et al. (2017) for QGs and SFGs, respectively. Diamonds represents the median value for our three categories of galaxy, and circles are the median value when restricting these galaxies to those with 109.7 < (M*/M⊙) < 1010.7 and z < 2. The arrows show how these median values would evolve in the next 600 Myr by assuming that the SFRs of these galaxies remain constant over this period and that newborn stars follow the light distribution observed in the MIR.
Current usage metrics show cumulative count of Article Views (full-text article views including HTML views, PDF and ePub downloads, according to the available data) and Abstracts Views on Vision4Press platform.
Data correspond to usage on the plateform after 2015. The current usage metrics is available 48-96 hours after online publication and is updated daily on week days.
Initial download of the metrics may take a while.