Fig. 14.
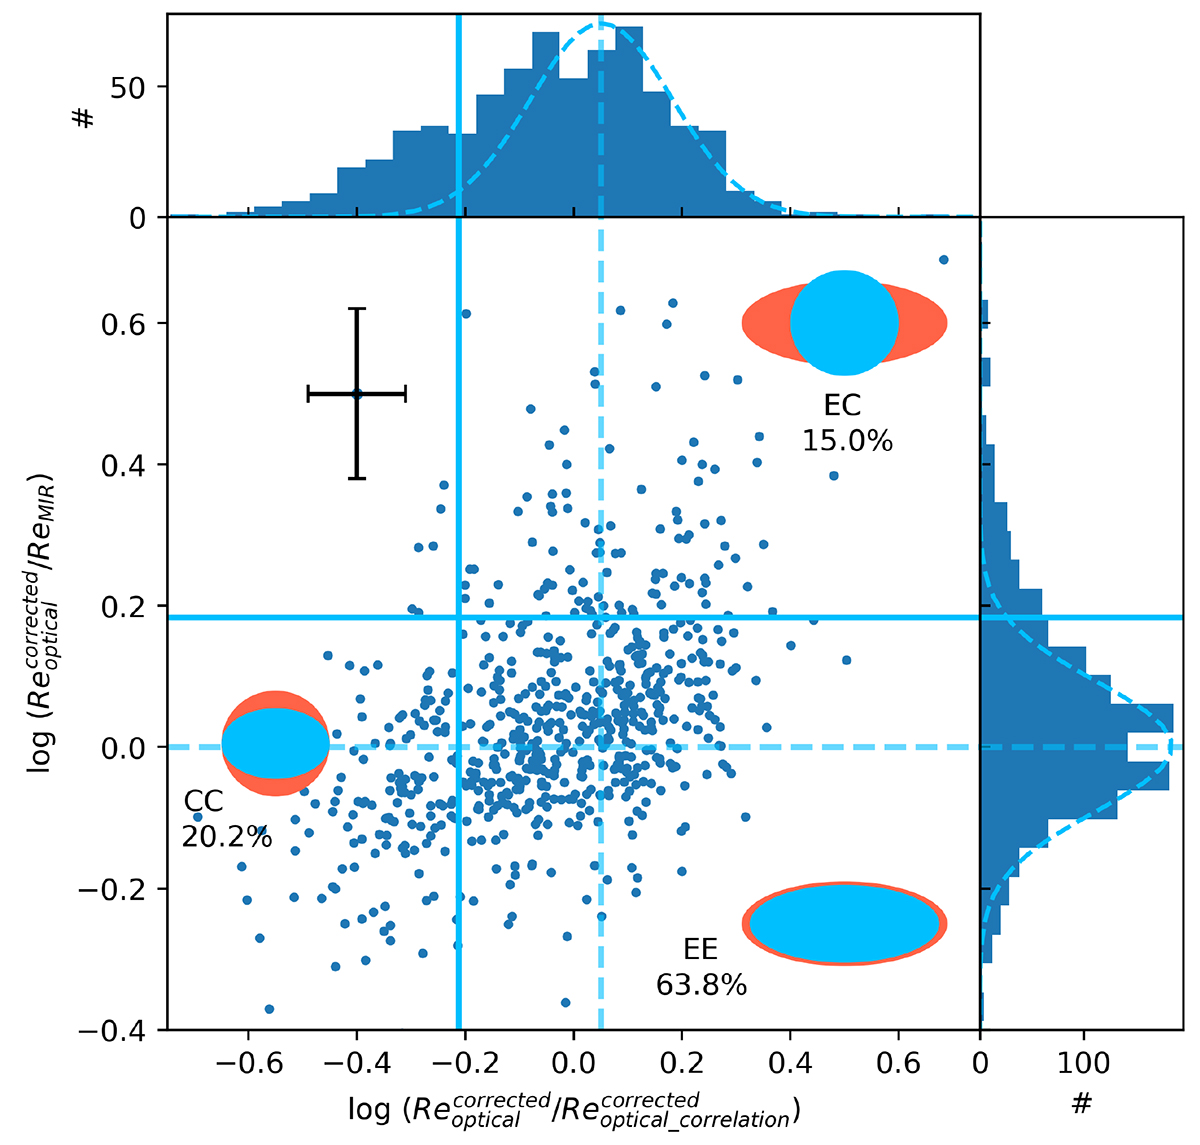
Download original image
ΔReoptical (distance to the optical mass–size relation) compared with the optical-to-MIR size ratio for our strategy 2 sample. The median error bar is shown in black in the upper left. A Gaussian function is fit to both the ΔReoptical and the size ratio distributions, as the dashed blue curve shows. Dashed blue lines show the median of the fitting, while solid blue lines show the 2σ threshold. Based on the median values for each category of galaxy in Table 3, we sketched a schematic representation of the three galaxy classifications. Orange and blue regions are stellar and star-forming components, respectively. EE stands for extended stellar and extended SFGs. EC stands for extended stellar and compact SFGs. CC stands for compact stellar and compact SFGs. The number fraction of each category of galaxies are also given below each sketch.
Current usage metrics show cumulative count of Article Views (full-text article views including HTML views, PDF and ePub downloads, according to the available data) and Abstracts Views on Vision4Press platform.
Data correspond to usage on the plateform after 2015. The current usage metrics is available 48-96 hours after online publication and is updated daily on week days.
Initial download of the metrics may take a while.