Fig. 12.
Download original image
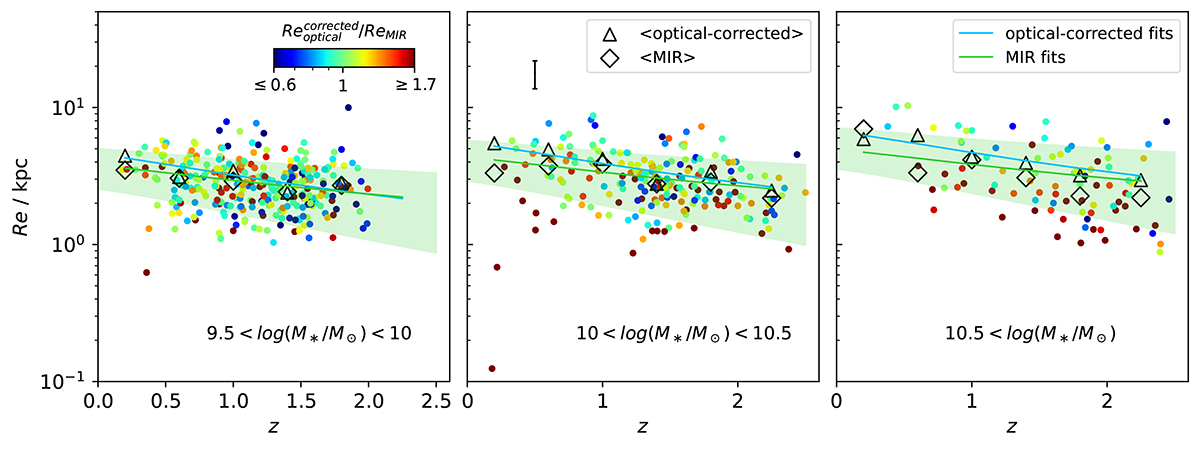
Redshift evolution of the MIR effective radius in three different stellar mass ranges. Circles are color-coded by their MIR-to-optical size ratio. The black diamonds are the sliding median for the MIR sizes. The median error bar is shown in black in the upper middle panel. The green lines show the best fitting results using Eq. (5) and the shaded green regions are the corresponding scatter. Finally, the black triangles are the sliding median for the optical sizes of the same galaxies, while the blue lines show the best-fitting results for these sizes using Eq. (5).
Current usage metrics show cumulative count of Article Views (full-text article views including HTML views, PDF and ePub downloads, according to the available data) and Abstracts Views on Vision4Press platform.
Data correspond to usage on the plateform after 2015. The current usage metrics is available 48-96 hours after online publication and is updated daily on week days.
Initial download of the metrics may take a while.