Fig. 11.
Download original image
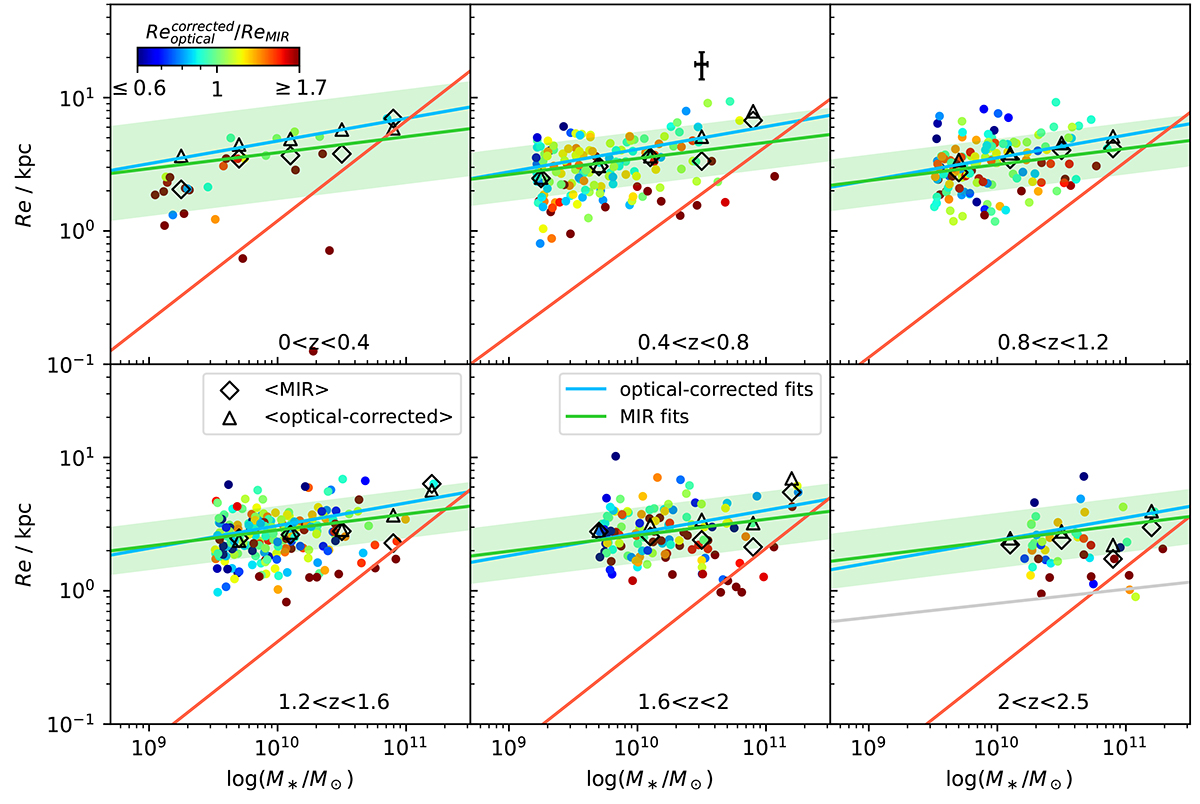
Effective radius vs. stellar mass for galaxies in our strategy 2 sample divided into six redshift bins. Circles are MIR size color-coded by their optical-to-MIR size ratio. Black diamonds and triangles represent the sliding median for MIR and optical measurements, respectively. The median error bar is shown in black in the upper middle panel. The solid green lines are our best-fitting mass–size relation for the MIR; the shaded regions are the corresponding 1σ uncertainties. The solid blue lines are our best-fitting optical mass–size relation. The solid red lines are the optical mass–size relation inferred in van der Wel et al. (2014) for QGs. The solid gray line is the mass–size relation inferred from Gómez-Guijarro et al. (2022) with ALMA for massive, high-redshift SFGs (M* > 1010.5 M⊙, z > 2.5).
Current usage metrics show cumulative count of Article Views (full-text article views including HTML views, PDF and ePub downloads, according to the available data) and Abstracts Views on Vision4Press platform.
Data correspond to usage on the plateform after 2015. The current usage metrics is available 48-96 hours after online publication and is updated daily on week days.
Initial download of the metrics may take a while.