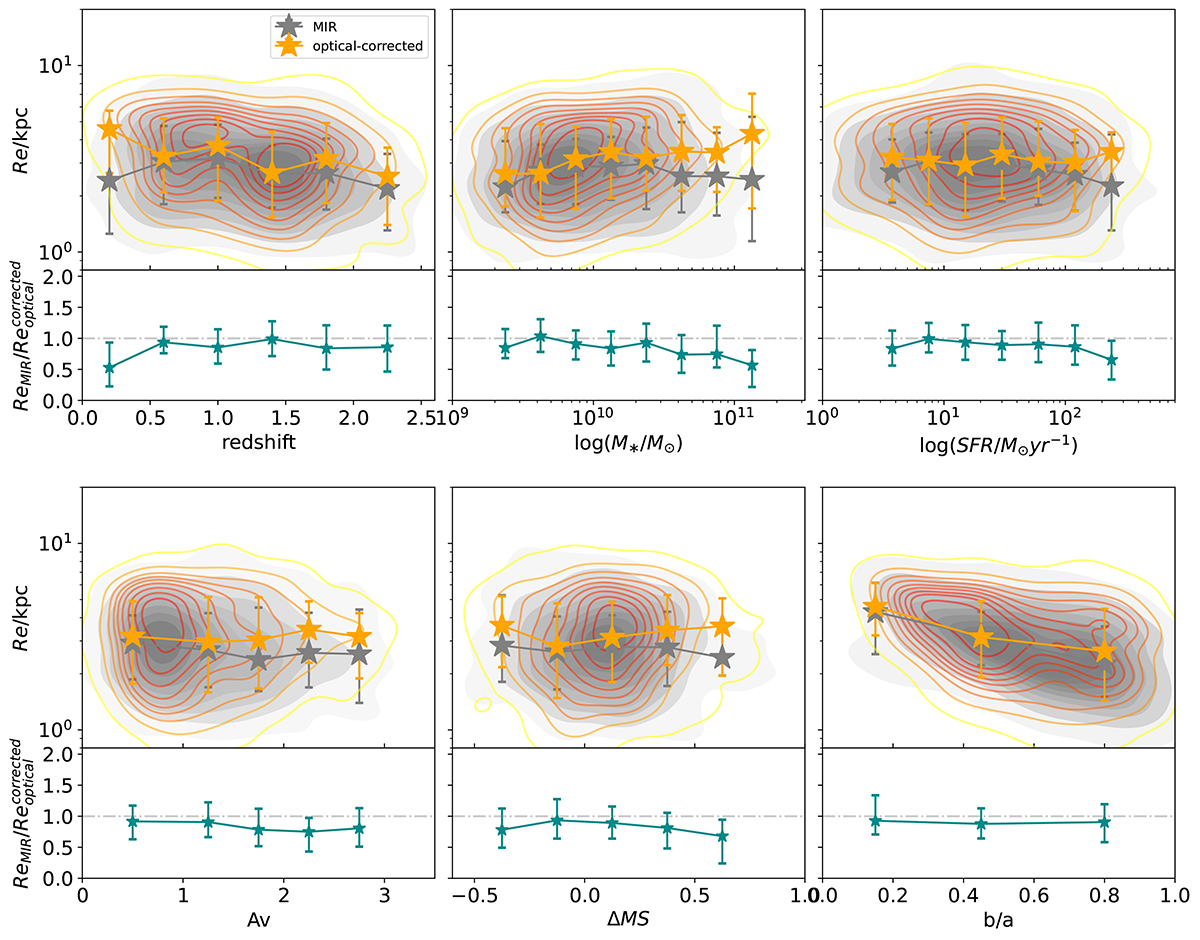
Fig. 10.
Download original image
Effective radius inferred from our strategy 2 sample, vs. various galaxy properties (redshift, stellar mass, SFR, dust attenuation, distance to main sequence, ΔMS, and MIR axis ratio). Gray and yellow contours mark the underlying distribution for MIR and optical measurements. Gray and yellow stars correspond to the median values, with 16th and 84th percentiles as error bars. The median error bars of different physical properties of galaxy are shown in black. In the bottom part of each panel, we display the effective radius ratio between MIR and optical measurements as a function of galaxy properties.
Current usage metrics show cumulative count of Article Views (full-text article views including HTML views, PDF and ePub downloads, according to the available data) and Abstracts Views on Vision4Press platform.
Data correspond to usage on the plateform after 2015. The current usage metrics is available 48-96 hours after online publication and is updated daily on week days.
Initial download of the metrics may take a while.