Fig. 6
Download original image
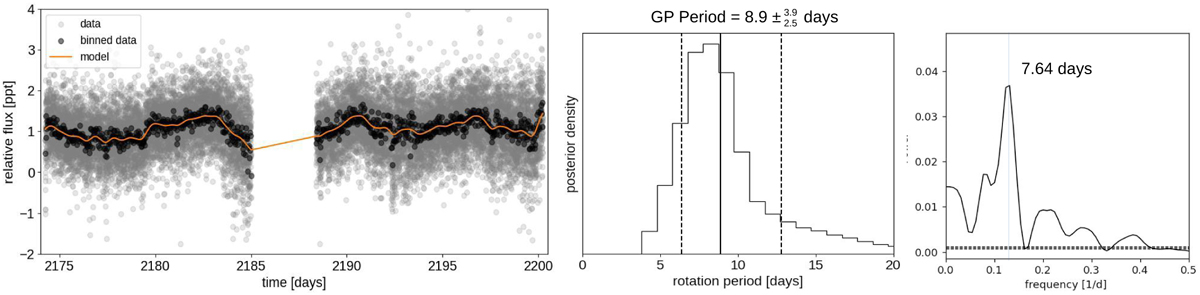
Left: TESS PLD LC (gray points) with the MAP model prediction. It is important to note that the long trends and transits have been removed prior to analysis. The orange line shows the predictive mean. Middle: probability density of the rotation period. The 1σ error bar is indicated with the dashed black lines. Right: GLS periodogram of the TESS PLD LC which was processed in accordance with the methods outlined in the text.
Current usage metrics show cumulative count of Article Views (full-text article views including HTML views, PDF and ePub downloads, according to the available data) and Abstracts Views on Vision4Press platform.
Data correspond to usage on the plateform after 2015. The current usage metrics is available 48-96 hours after online publication and is updated daily on week days.
Initial download of the metrics may take a while.