Fig. 5
Download original image
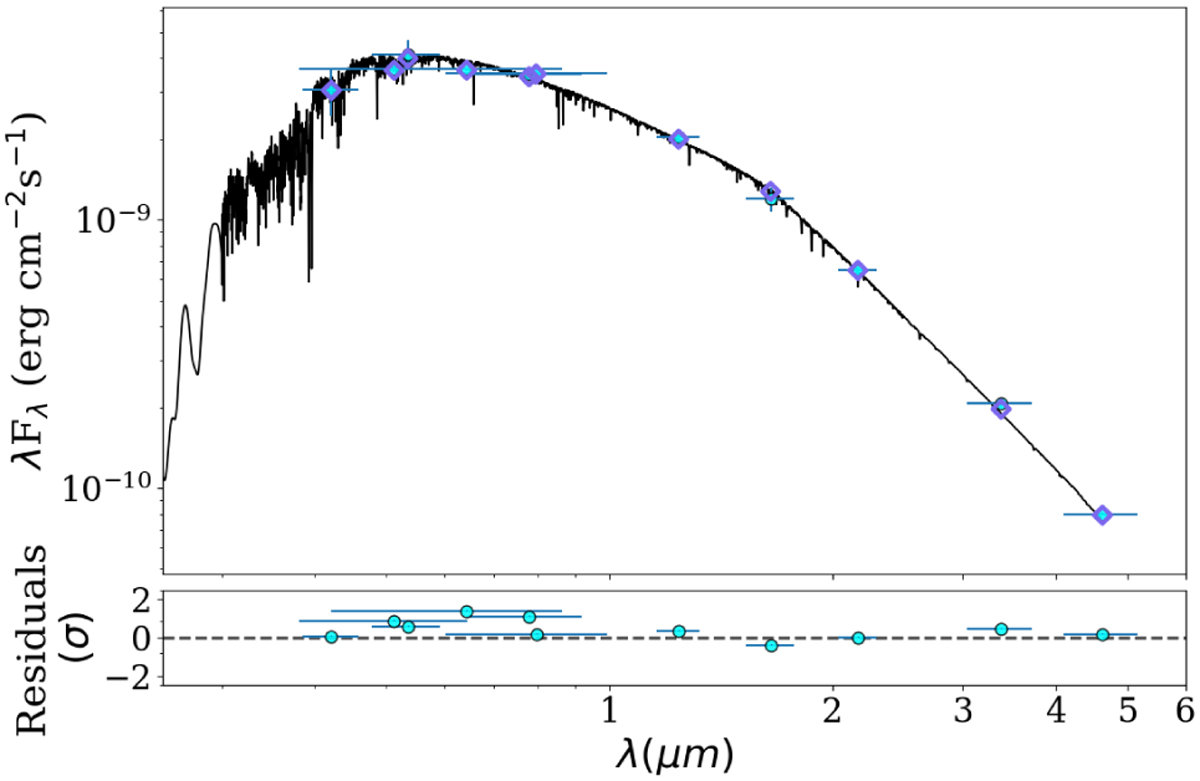
SED fit for the TOI-2458 system. The blue points with vertical error bars show the observed catalog fluxes and uncertainties from Gaia, TESS, Tycho-2, 2MASS, and WISE, while the horizontal error bars illustrate the width of the photometric band. For illustrative purposes, we overplot the best-matching Phoenix atmospheric model (Husser et al. 2013).
Current usage metrics show cumulative count of Article Views (full-text article views including HTML views, PDF and ePub downloads, according to the available data) and Abstracts Views on Vision4Press platform.
Data correspond to usage on the plateform after 2015. The current usage metrics is available 48-96 hours after online publication and is updated daily on week days.
Initial download of the metrics may take a while.