Fig. 2
Download original image
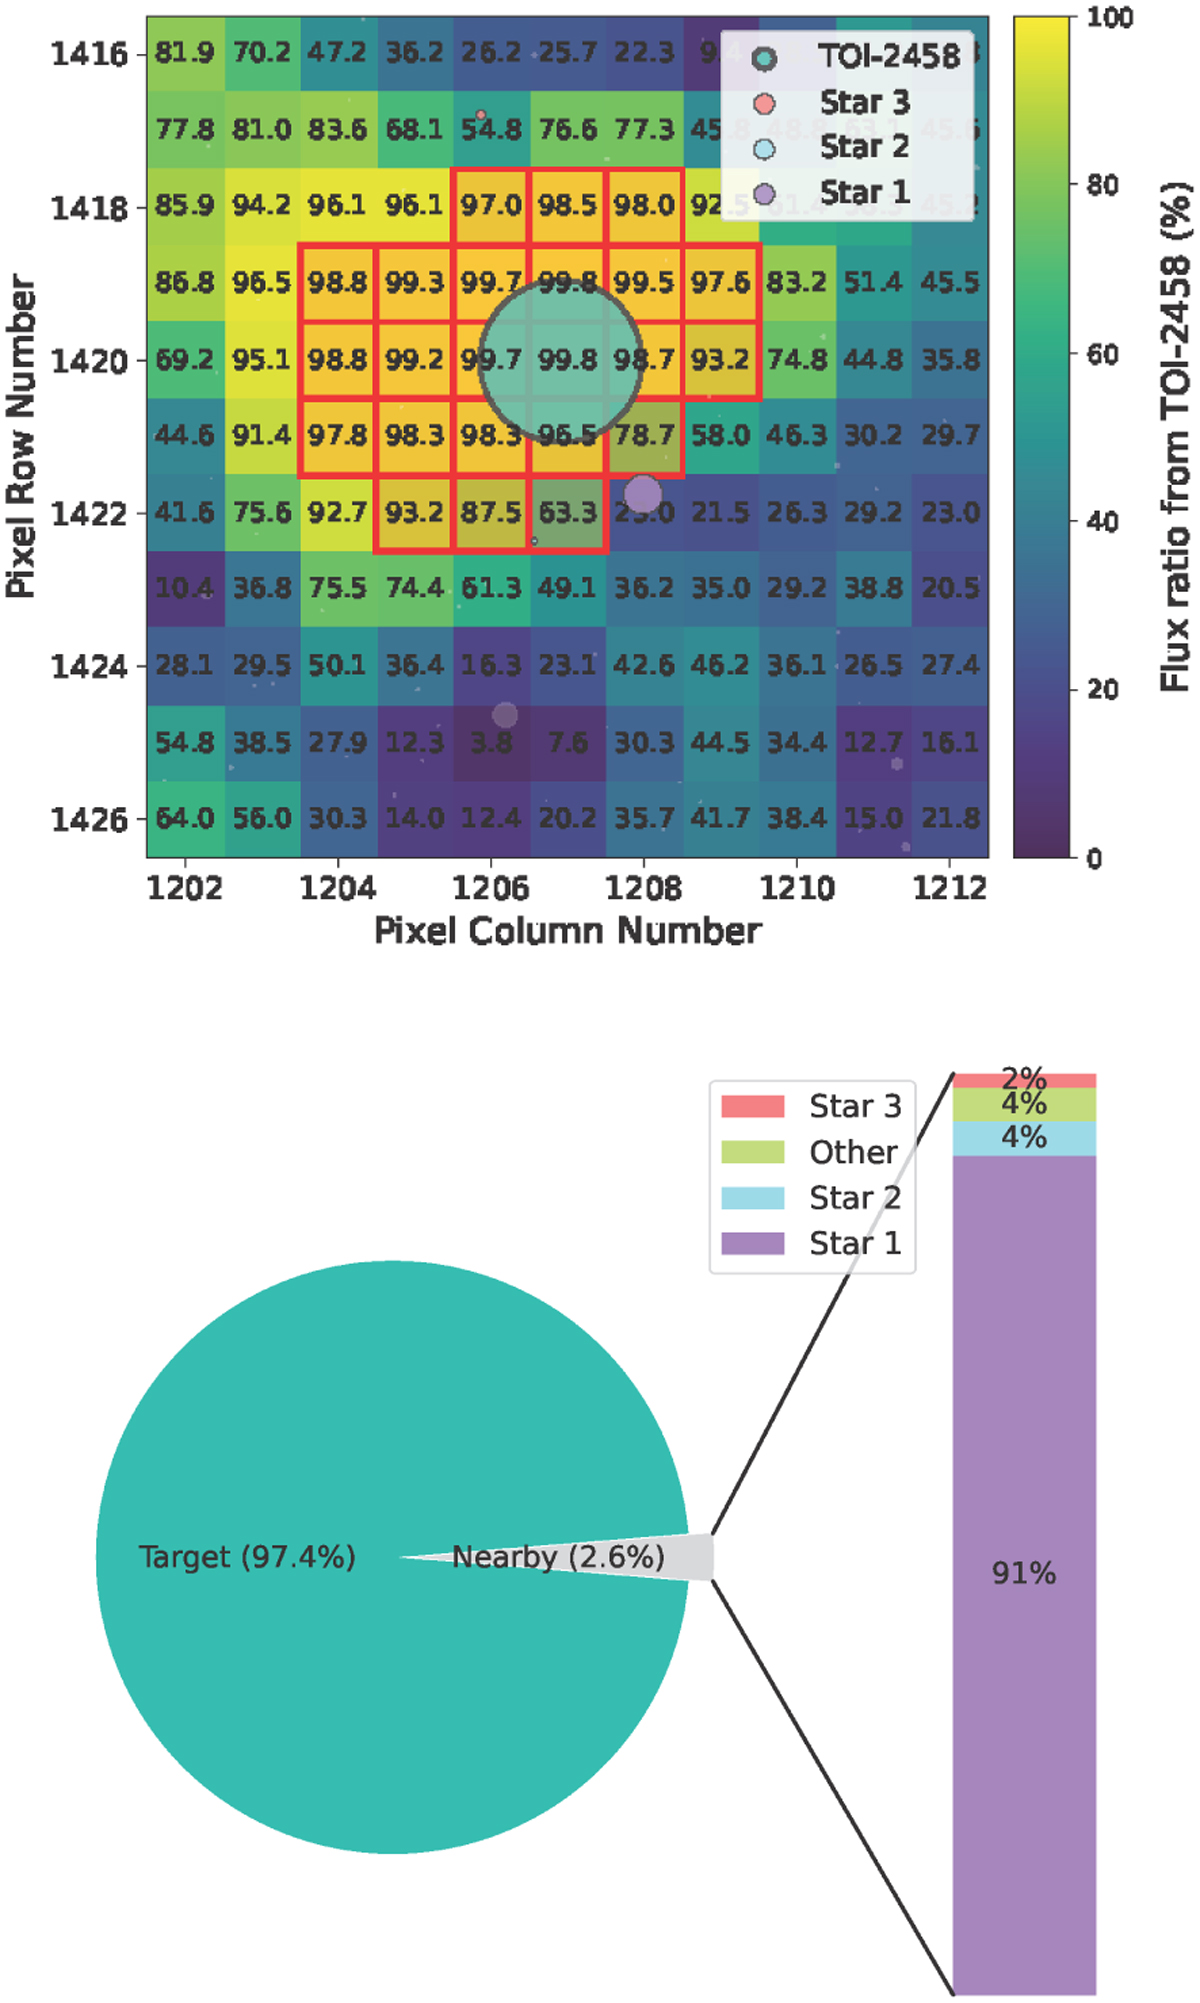
Top: heatmap illustrating the percentage of the flux from TOI-2458 that falls within each pixel of the TESS TPF image using Gaia DR2/DR3 catalogs. Bottom: pie chart representing the flux from the target and nearby stars inside the photometric aperture. Star 1 (Gaia ID 3233785163260952192) is the primary source of contamination.
Current usage metrics show cumulative count of Article Views (full-text article views including HTML views, PDF and ePub downloads, according to the available data) and Abstracts Views on Vision4Press platform.
Data correspond to usage on the plateform after 2015. The current usage metrics is available 48-96 hours after online publication and is updated daily on week days.
Initial download of the metrics may take a while.