Fig. 13
Download original image
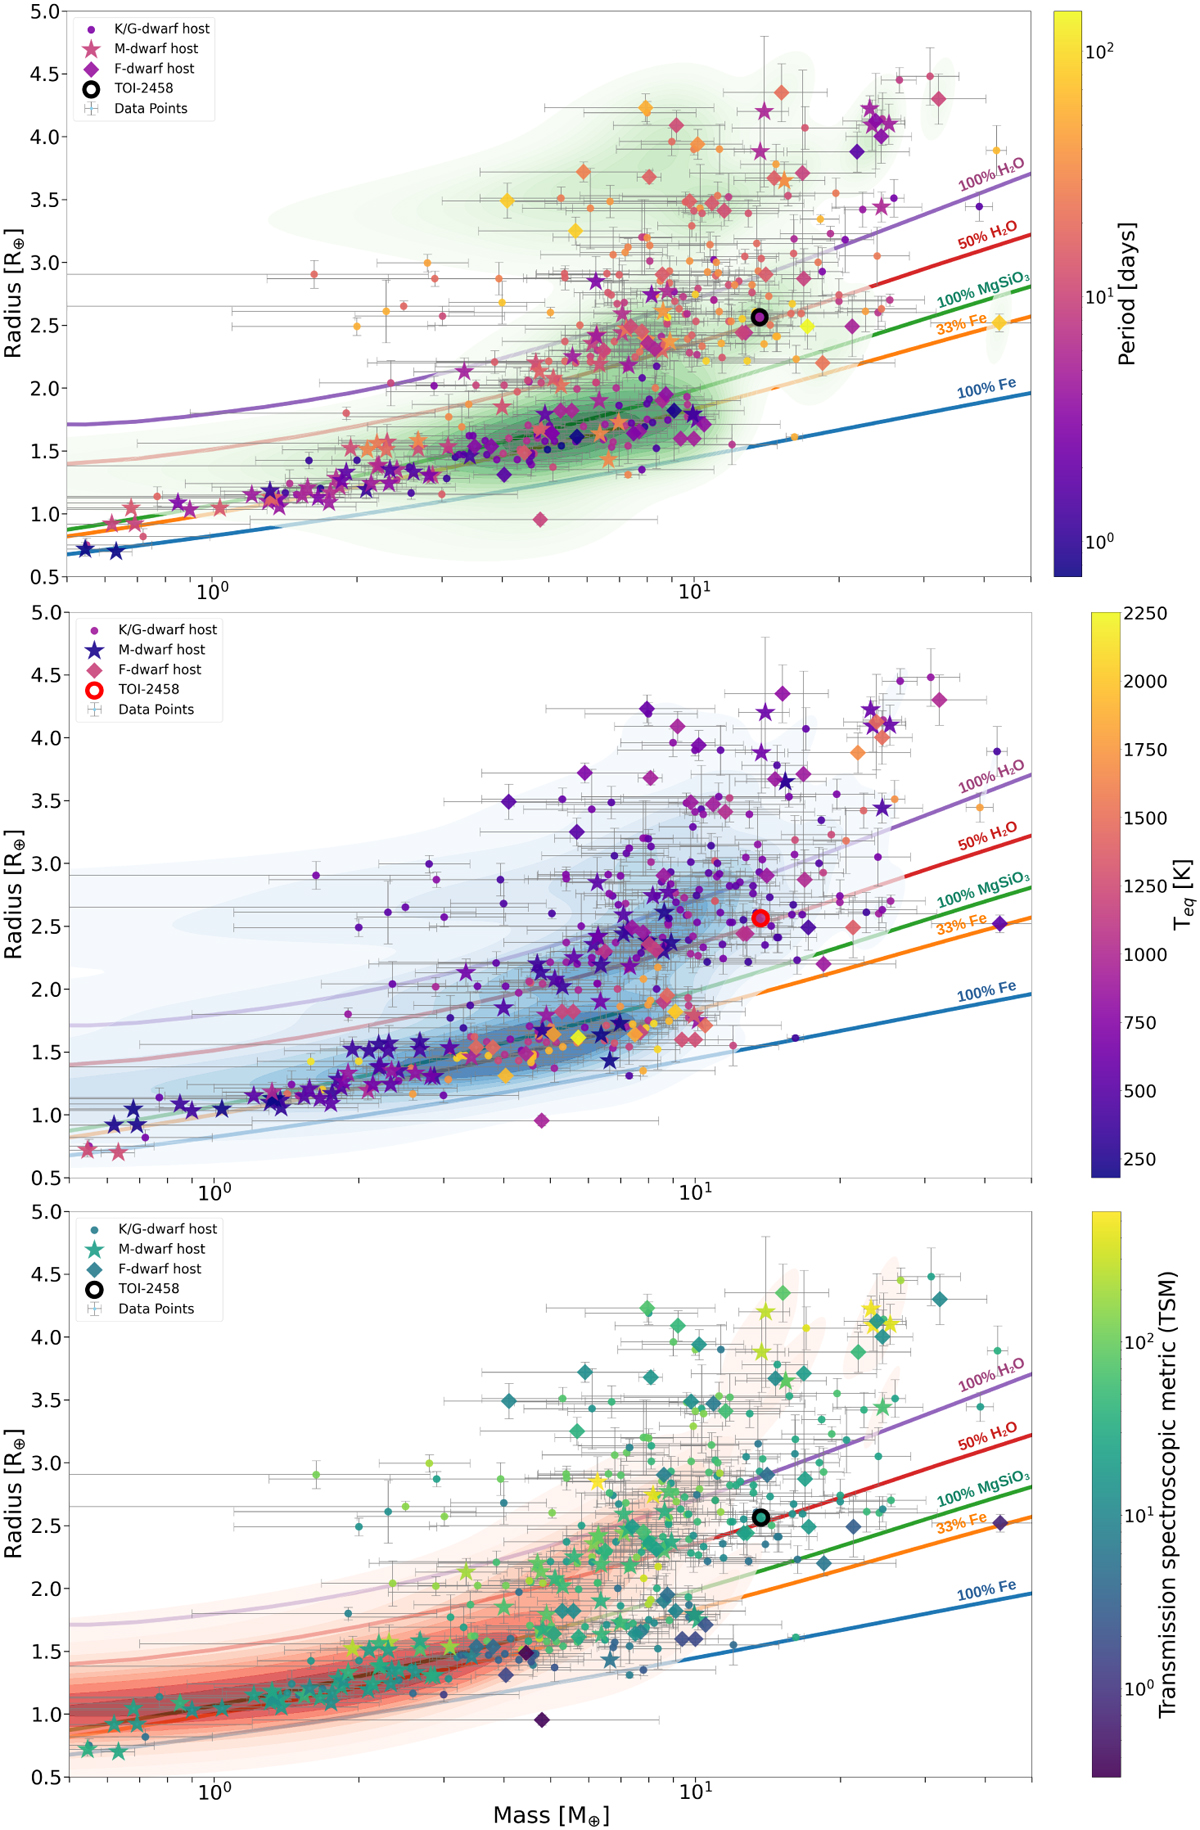
The population of known companions within the mass interval 0.5–50 M⊕. The position of TOI-2458 b is highlighted. The top subplot is color-coded based on the orbital period of the planets, the middle one based on the equilibrium temperature, and the bottom one based on the transmission spectroscopic metric of the planets. The background shows the kernel density estimate (KDE) with green, blue, and red colors representing planets around F, K/G, and M stars, respectively. The mass-radius tracks from Zeng et al. (2019) are utilized.
Current usage metrics show cumulative count of Article Views (full-text article views including HTML views, PDF and ePub downloads, according to the available data) and Abstracts Views on Vision4Press platform.
Data correspond to usage on the plateform after 2015. The current usage metrics is available 48-96 hours after online publication and is updated daily on week days.
Initial download of the metrics may take a while.