Fig. 10
Download original image
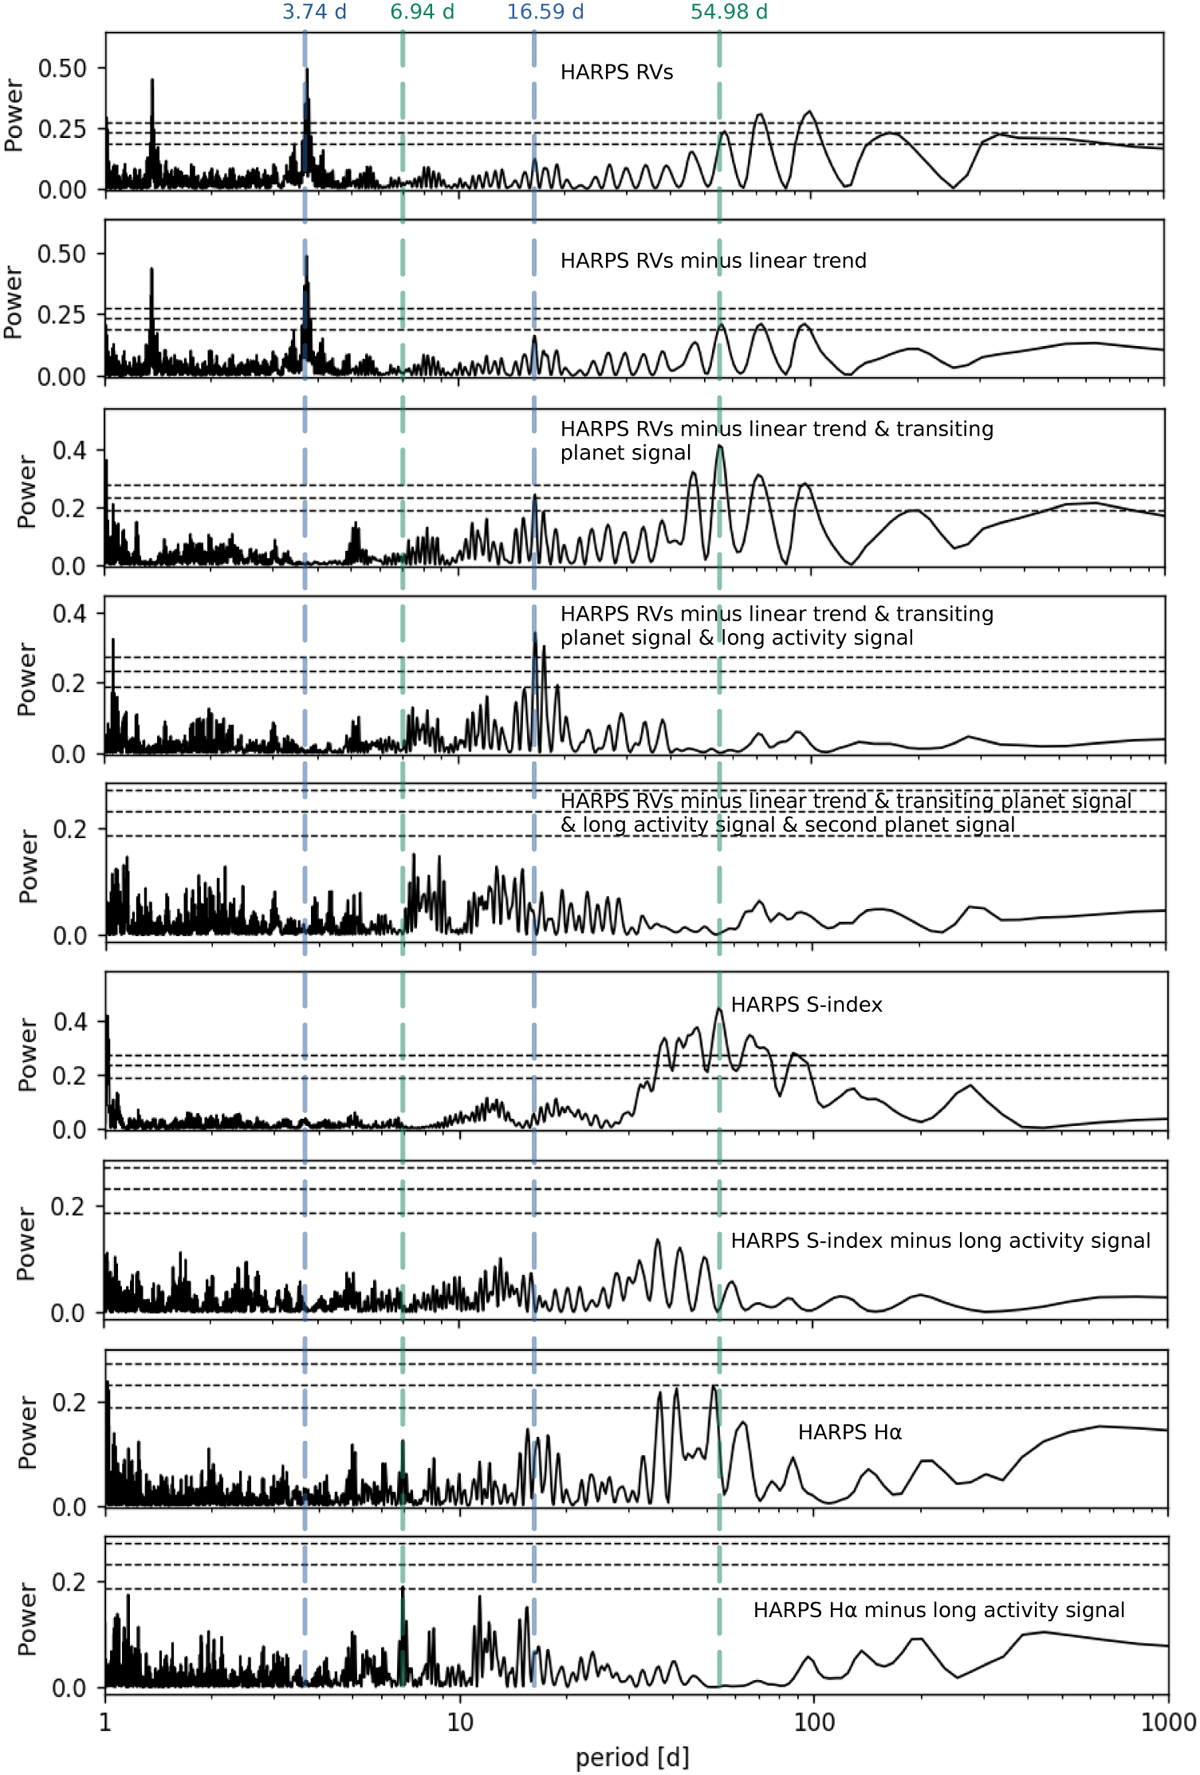
Generalized Lomb-Scargle periodograms of HARPS RVs of TOI- 2458 from top to bottom: (a) HARPS RVs, (b) HARPS RVs minus linear trend, (c) HARPS RVs minus linear trend and transiting planet signal, (d) HARPS RVs minus linear trend, transiting planet signal and long activity signal, (e) HARPS RVs minus linear trend, transiting planet signal, long activity signal and second planet signal, (f) HARPS S-index, (g) HARPS S-index minus long activity signal, (h) HARPS Hα, (i) HARPS Hα minus long activity signal. The vertical blue lines highlight the orbital period of the transiting companion and the second companion. The vertical green lines highlight the stellar activity signals. The 6.94-day line indicates the peak observed in the Hα activity indicator (last panel), which is near the rotation period identified in the TESS photometry. The 55-day line highlights the maximum signal from the S-index activity indicator. Horizontal dashed lines show the theoretical FAP levels of 10%, 1%, and 0.1% for each panel.
Current usage metrics show cumulative count of Article Views (full-text article views including HTML views, PDF and ePub downloads, according to the available data) and Abstracts Views on Vision4Press platform.
Data correspond to usage on the plateform after 2015. The current usage metrics is available 48-96 hours after online publication and is updated daily on week days.
Initial download of the metrics may take a while.