Fig. 1
Download original image
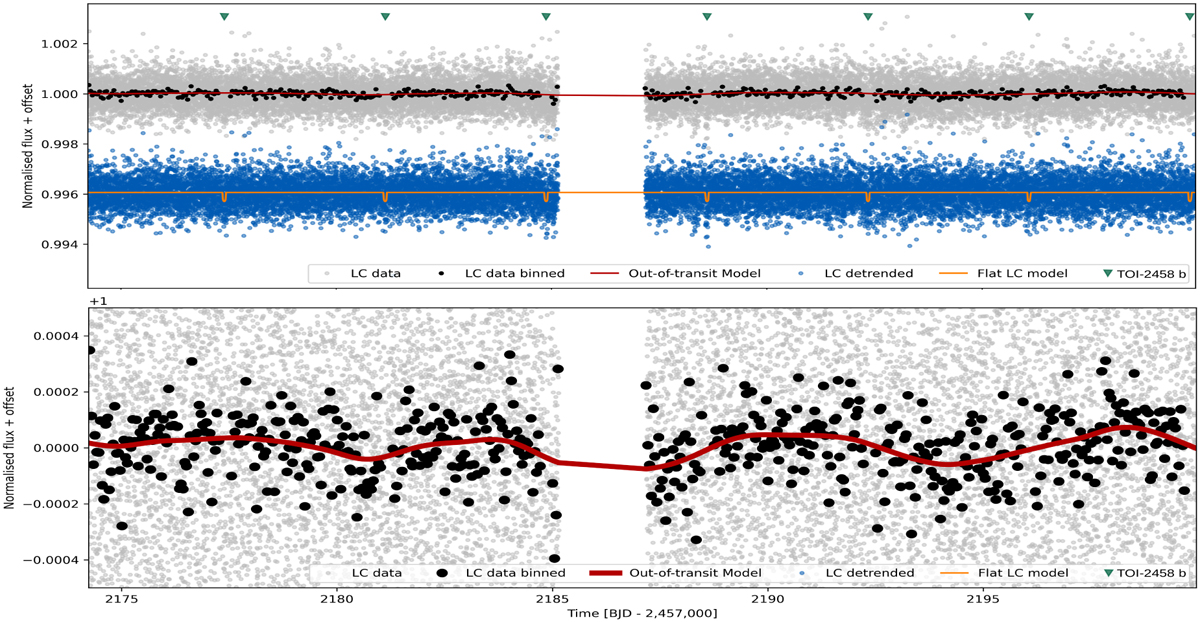
SPOC PDCSAP LC from TESS sector 32 for TOI-2458 downloaded with the lightkurve tool. Gray points represent the TESS observations, black points are binned TESS data, while red lines correspond to the out-of-transit GP models created with citlalicue to capture the variability in the LC. Datasets were divided by these models, leading to a flattened TESS LC (blue points) with the transit model (orange line). Green triangles indicate the positions of transits. The lower panel is a zoom-in of the upper panel highlighting the out-of-transit GP model.
Current usage metrics show cumulative count of Article Views (full-text article views including HTML views, PDF and ePub downloads, according to the available data) and Abstracts Views on Vision4Press platform.
Data correspond to usage on the plateform after 2015. The current usage metrics is available 48-96 hours after online publication and is updated daily on week days.
Initial download of the metrics may take a while.