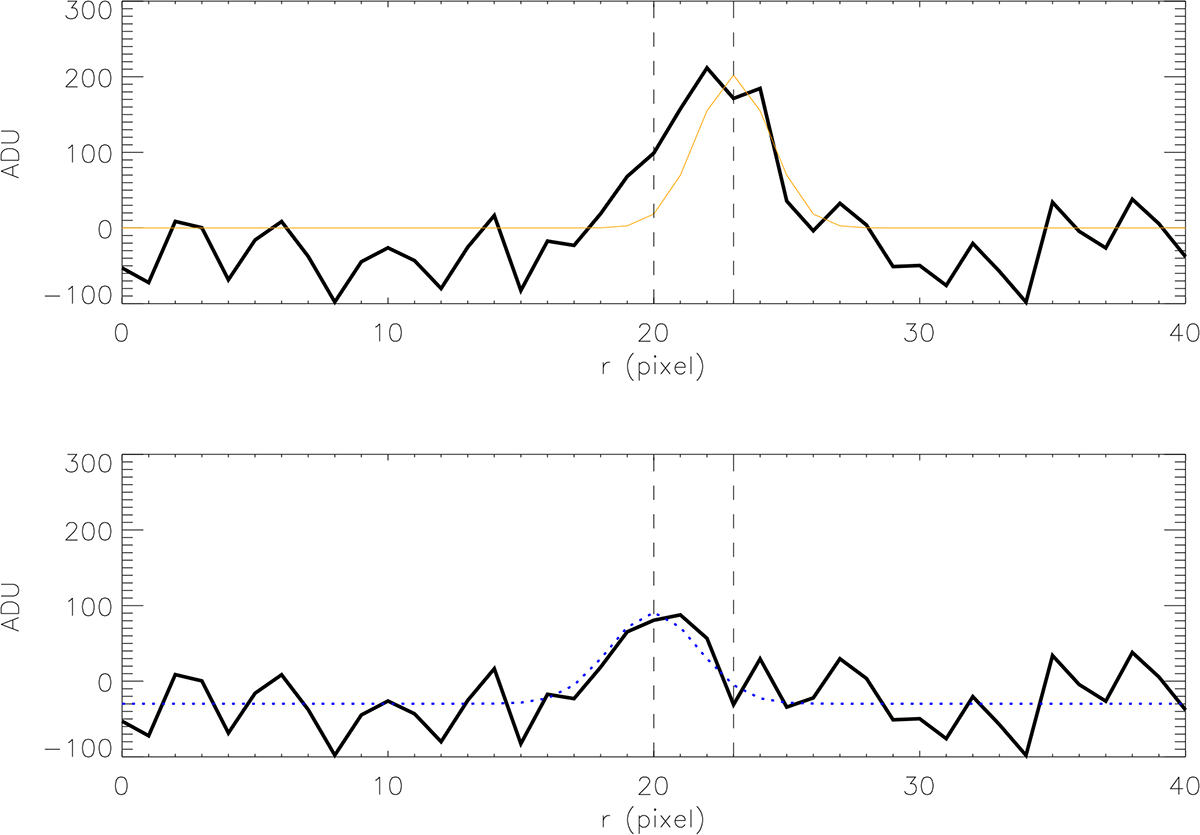
Fig. 5.
Download original image
Intensity plot of the combination of the 9 lines around the galaxy and blob. In the top panel, the black line is the same as the red line of Fig. 4) and the peak corresponding to the blob is fitted with a single Gaussian function. In the bottom panel, such Gaussian is removed from the profile and a different Gaussian function is fitted to the remaining signal, corresponding to the flux of the host galaxy. The vertical dashed lines are the same as in Fig. 4 and represent the peaks of the emission of the galaxy and the blob.
Current usage metrics show cumulative count of Article Views (full-text article views including HTML views, PDF and ePub downloads, according to the available data) and Abstracts Views on Vision4Press platform.
Data correspond to usage on the plateform after 2015. The current usage metrics is available 48-96 hours after online publication and is updated daily on week days.
Initial download of the metrics may take a while.