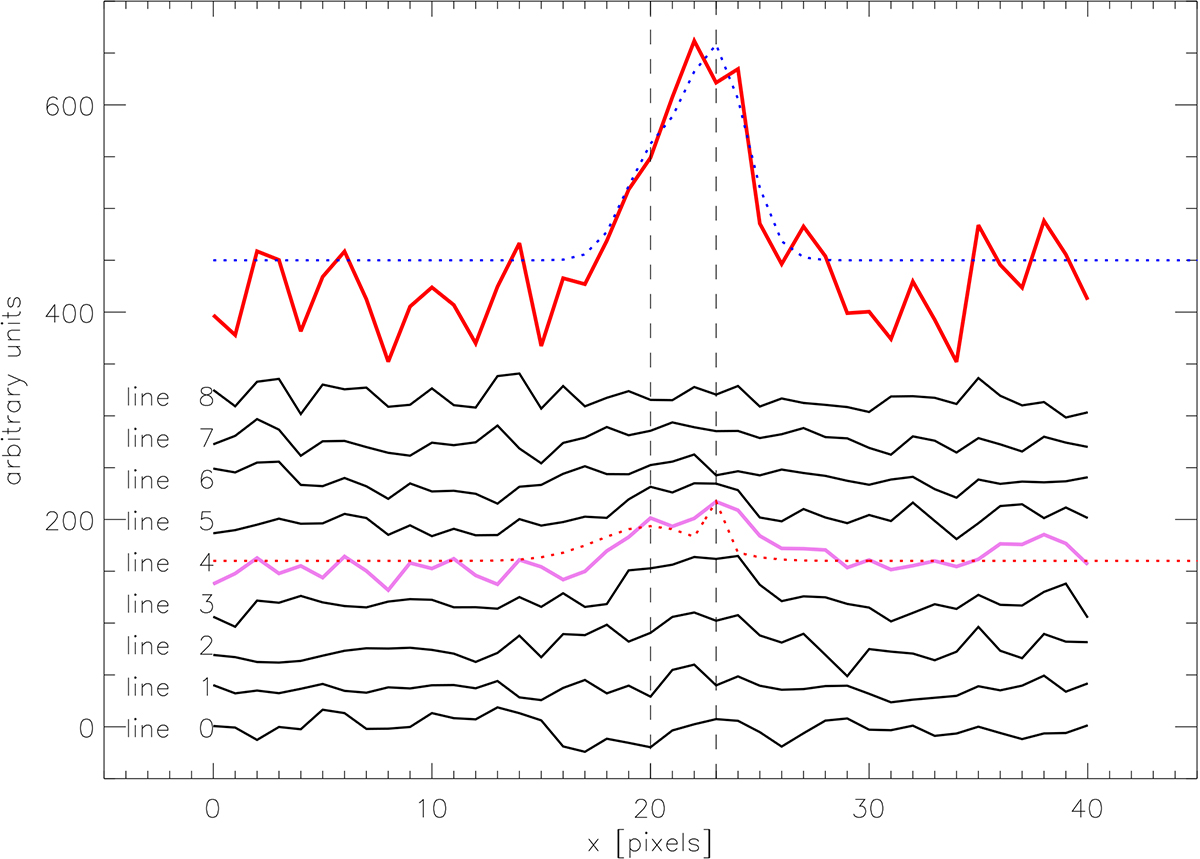
Fig. 4.
Download original image
Intensity plots of the nine rows around the peaks of the blob and its host galaxy. The pixels row containing the emission peaks of the blob and the galaxy companion is highlighted in violet, whereas in red we show the combination of all the nine lines fitted with a double Gaussian function (blue dotted line). The vertical axis is in arbitrary unit since, for sake of clarity, we add a vertical offset of 40 ADU to every individual row. Moreover, we also added 450 ADUs to the counts of the red solid line.
Current usage metrics show cumulative count of Article Views (full-text article views including HTML views, PDF and ePub downloads, according to the available data) and Abstracts Views on Vision4Press platform.
Data correspond to usage on the plateform after 2015. The current usage metrics is available 48-96 hours after online publication and is updated daily on week days.
Initial download of the metrics may take a while.