Fig. 3.
Download original image
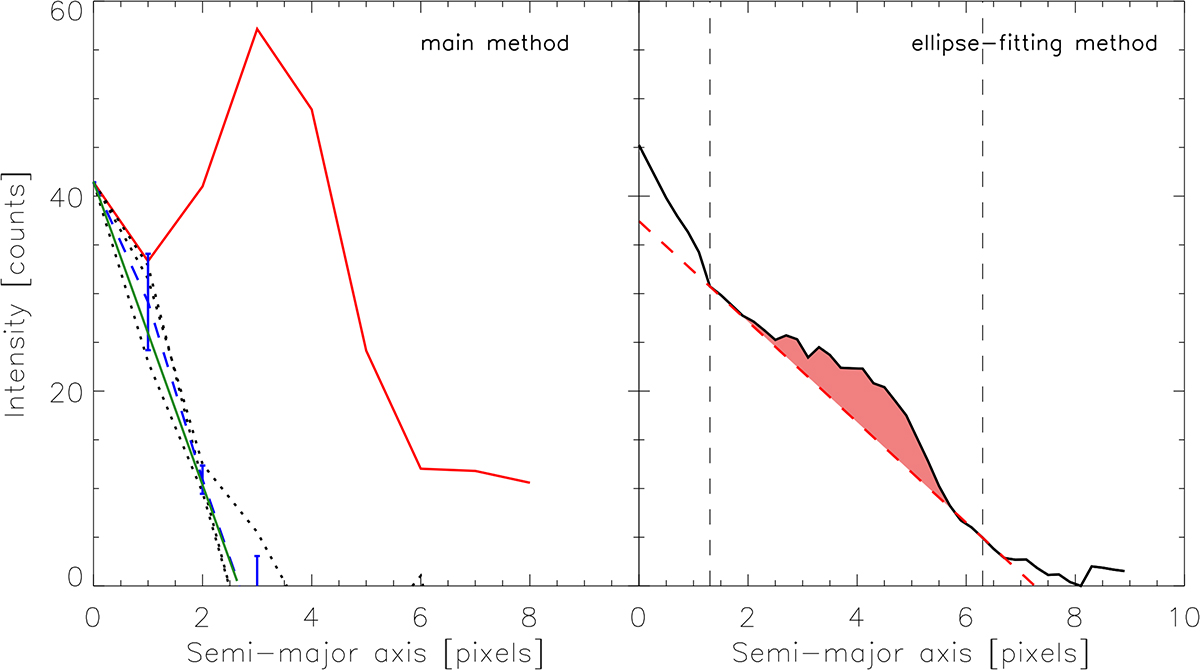
Results from our main method (subtraction of a Sérsic profile to the SB profile of the galaxy, left panel) and from the ellipse-fitting method (right panel). Left panel: radial profiles of the galaxy in the three directions where the blob is not present (black dotted lines). The mean profile is represented with the blue dashed line (with corresponding uncertainties) and the Sérsic profile that we choose to represent the profile is shown with the green solid line. The red solid line represents the profile of the blob. Right panel: radial dependency of the intensity of the ellipses fitted with the IRAF task ellipse. The peak centred at about sma = 4 corresponds to the region of the blob. The red dashed line is connecting two points of the profile: the internal one is where there is an abrupt change in the slope of the profile, whereas the external point is the last point above the zero level. These two points are indicated by the two vertical lines. The coral area represent the difference between the profile and the red dashed line.
Current usage metrics show cumulative count of Article Views (full-text article views including HTML views, PDF and ePub downloads, according to the available data) and Abstracts Views on Vision4Press platform.
Data correspond to usage on the plateform after 2015. The current usage metrics is available 48-96 hours after online publication and is updated daily on week days.
Initial download of the metrics may take a while.