Fig. 2.
Download original image
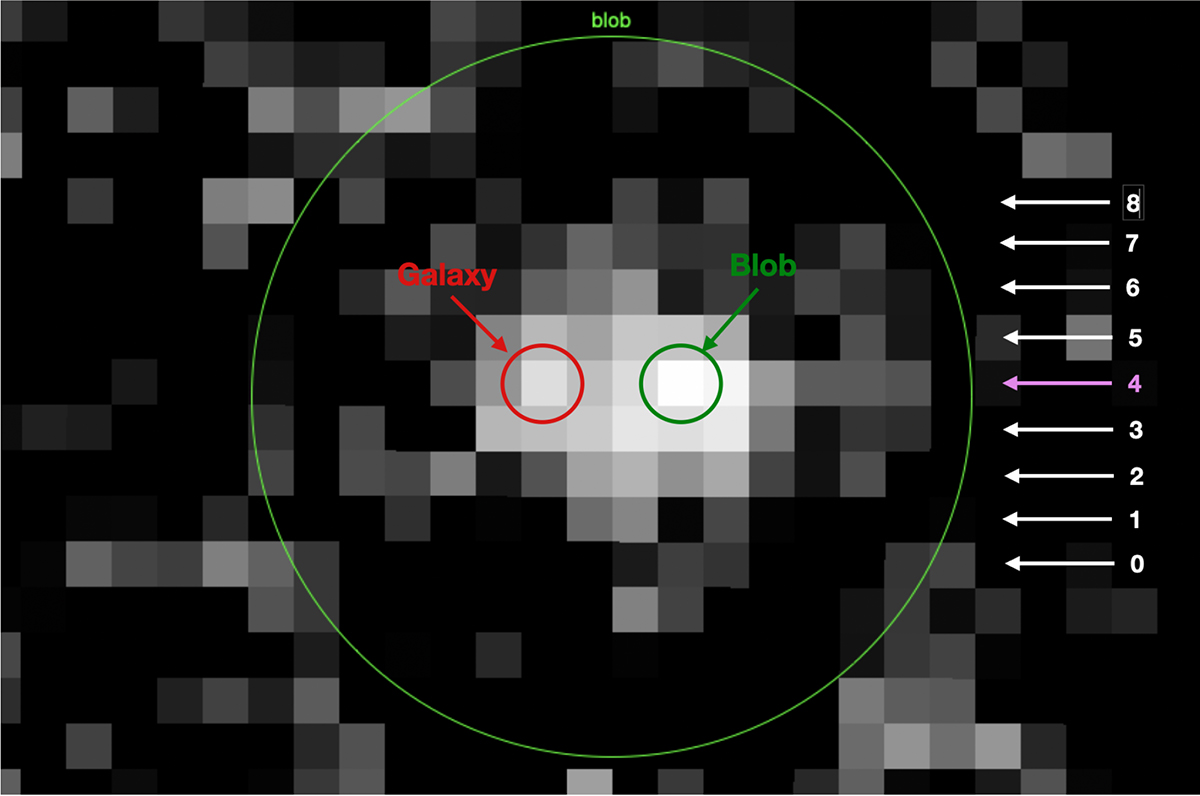
Blob and its host galaxy. The large green circle represents a region of 2![]() 0 around the detected object, whereas the arrows on the right side represent the nine lines that we plotted individually in Fig. 4, with the one connecting the two centres highlighted in violet. Moreover, the small red and green circles are the centres of the galaxy and the blob, respectively.
0 around the detected object, whereas the arrows on the right side represent the nine lines that we plotted individually in Fig. 4, with the one connecting the two centres highlighted in violet. Moreover, the small red and green circles are the centres of the galaxy and the blob, respectively.
Current usage metrics show cumulative count of Article Views (full-text article views including HTML views, PDF and ePub downloads, according to the available data) and Abstracts Views on Vision4Press platform.
Data correspond to usage on the plateform after 2015. The current usage metrics is available 48-96 hours after online publication and is updated daily on week days.
Initial download of the metrics may take a while.