Fig. 6
Download original image
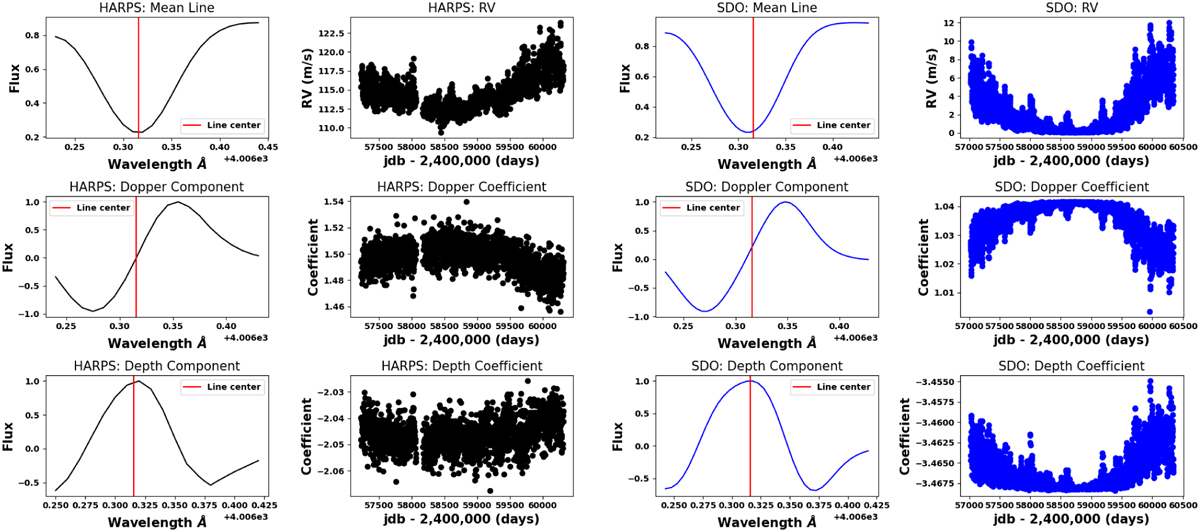
Example of line profile decomposition in the Doppler-shift and line-depth domains for the FeI line at 4006.31 Å. First column: line profiles of HARPS-N solar spectra. The top panel is the average line profile. The middle panel is the Doppler component of that line. The bottom panel is the depth component of the line. Second column: top panel is the RVs measured from the CCFs. The coefficients associated with the Doppler and depth components are shown in the middle and bottom panels, respectively. Third and fourth columns: same as the first and second columns, but for the simulated spectral line. The Pearson correlation between the line in the HARPS-N solar spectra and the same line in the simulated spectra is 0.70 for the Doppler component and 0.41 for the depth component.
Current usage metrics show cumulative count of Article Views (full-text article views including HTML views, PDF and ePub downloads, according to the available data) and Abstracts Views on Vision4Press platform.
Data correspond to usage on the plateform after 2015. The current usage metrics is available 48-96 hours after online publication and is updated daily on week days.
Initial download of the metrics may take a while.