Open Access
Fig. 1
Download original image
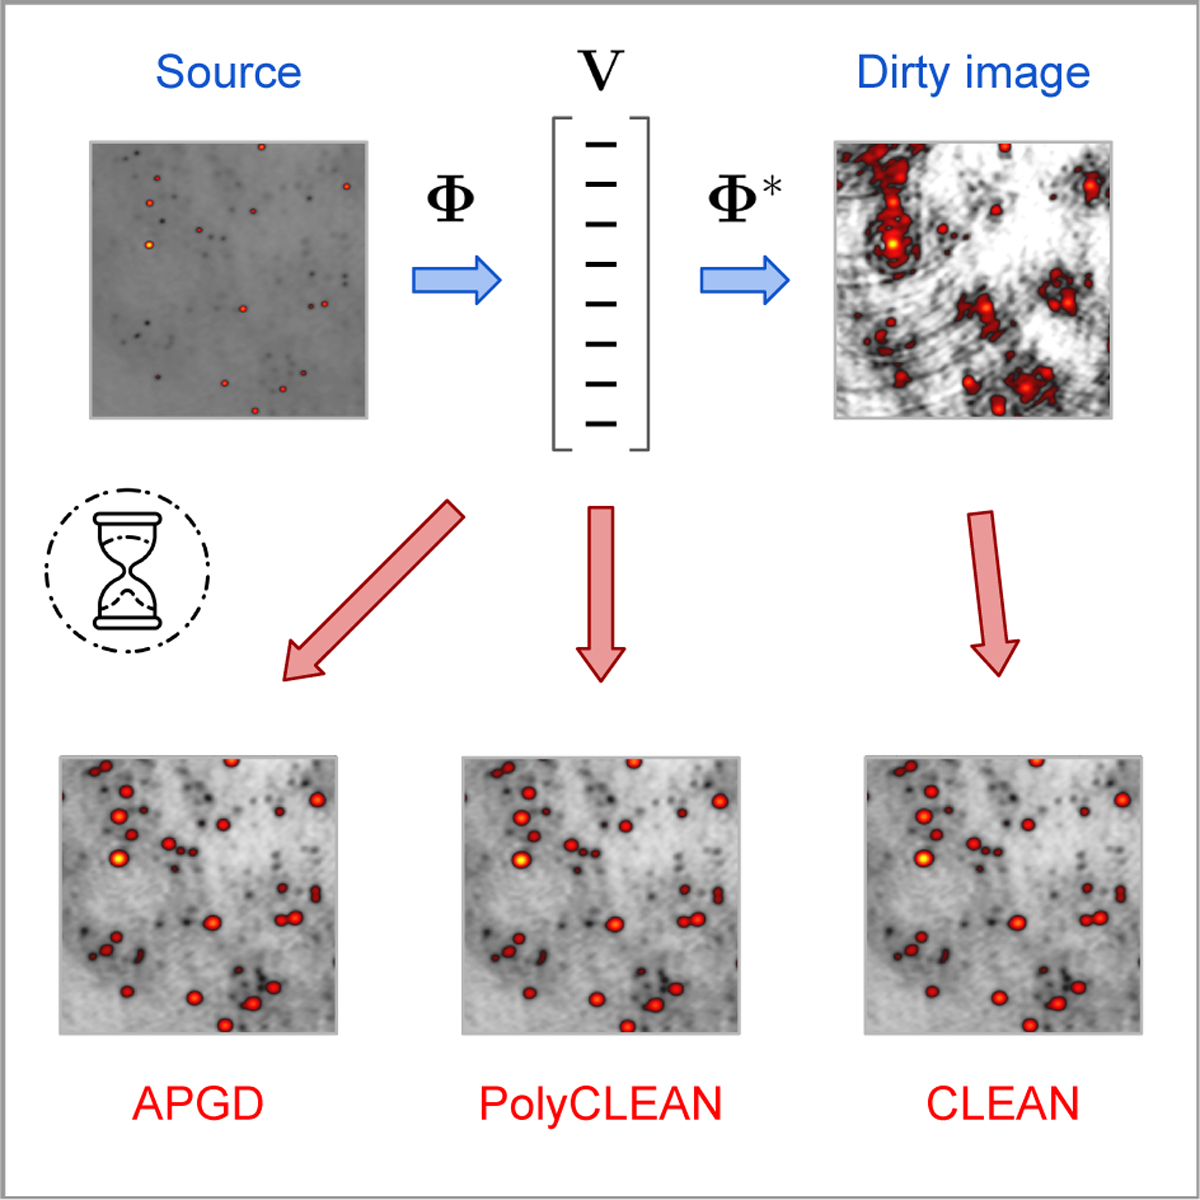
Schematic view of the simulation pipeline for the scalability experiment. The CLEAN procedure starts from the dirty image, while PolyCLEAN and APGD take as input the visibility measurements V and instantiate the initial iterate empty.
Current usage metrics show cumulative count of Article Views (full-text article views including HTML views, PDF and ePub downloads, according to the available data) and Abstracts Views on Vision4Press platform.
Data correspond to usage on the plateform after 2015. The current usage metrics is available 48-96 hours after online publication and is updated daily on week days.
Initial download of the metrics may take a while.