Fig. 9.
Download original image
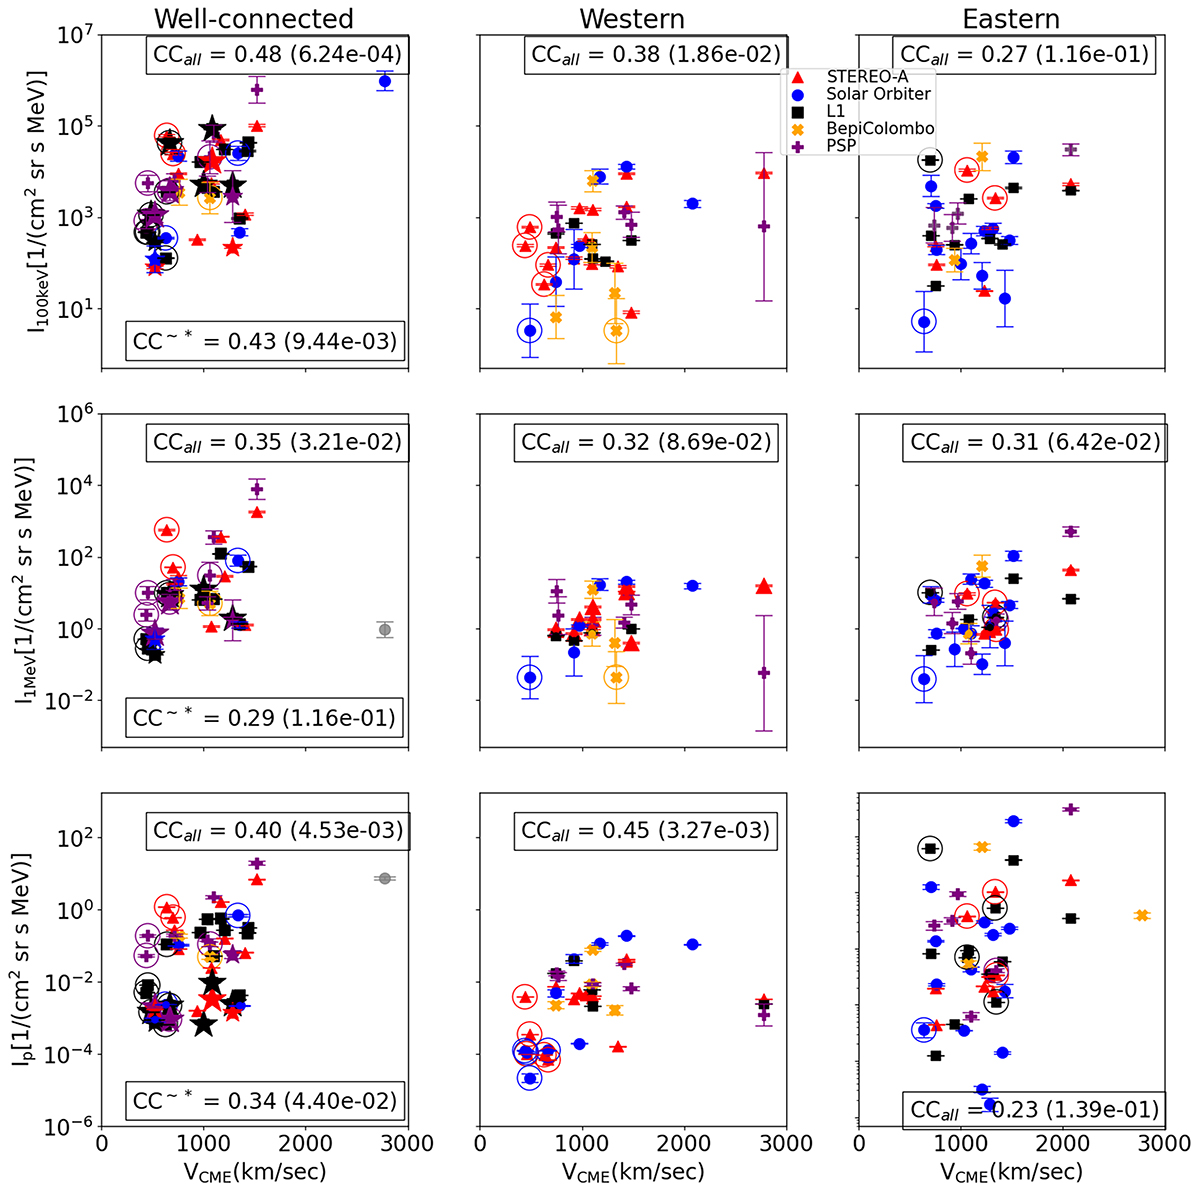
Peak intensities of SEPs as a function of projected linear CME speed for ∼100 keV electrons (top panel), 1 MeV electrons (central panel), and ≥25 MeV protons (bottom panel) for well-connected (left), western (middle), and eastern (right) events. All symbols are the same as in Fig. 2. CCall and CC∼* are the Spearman correlation coefficients along with the p-values for all events in the scatter plot, and for the rest of events, excluding the starred points, respectively.
Current usage metrics show cumulative count of Article Views (full-text article views including HTML views, PDF and ePub downloads, according to the available data) and Abstracts Views on Vision4Press platform.
Data correspond to usage on the plateform after 2015. The current usage metrics is available 48-96 hours after online publication and is updated daily on week days.
Initial download of the metrics may take a while.