Fig. 8.
Download original image
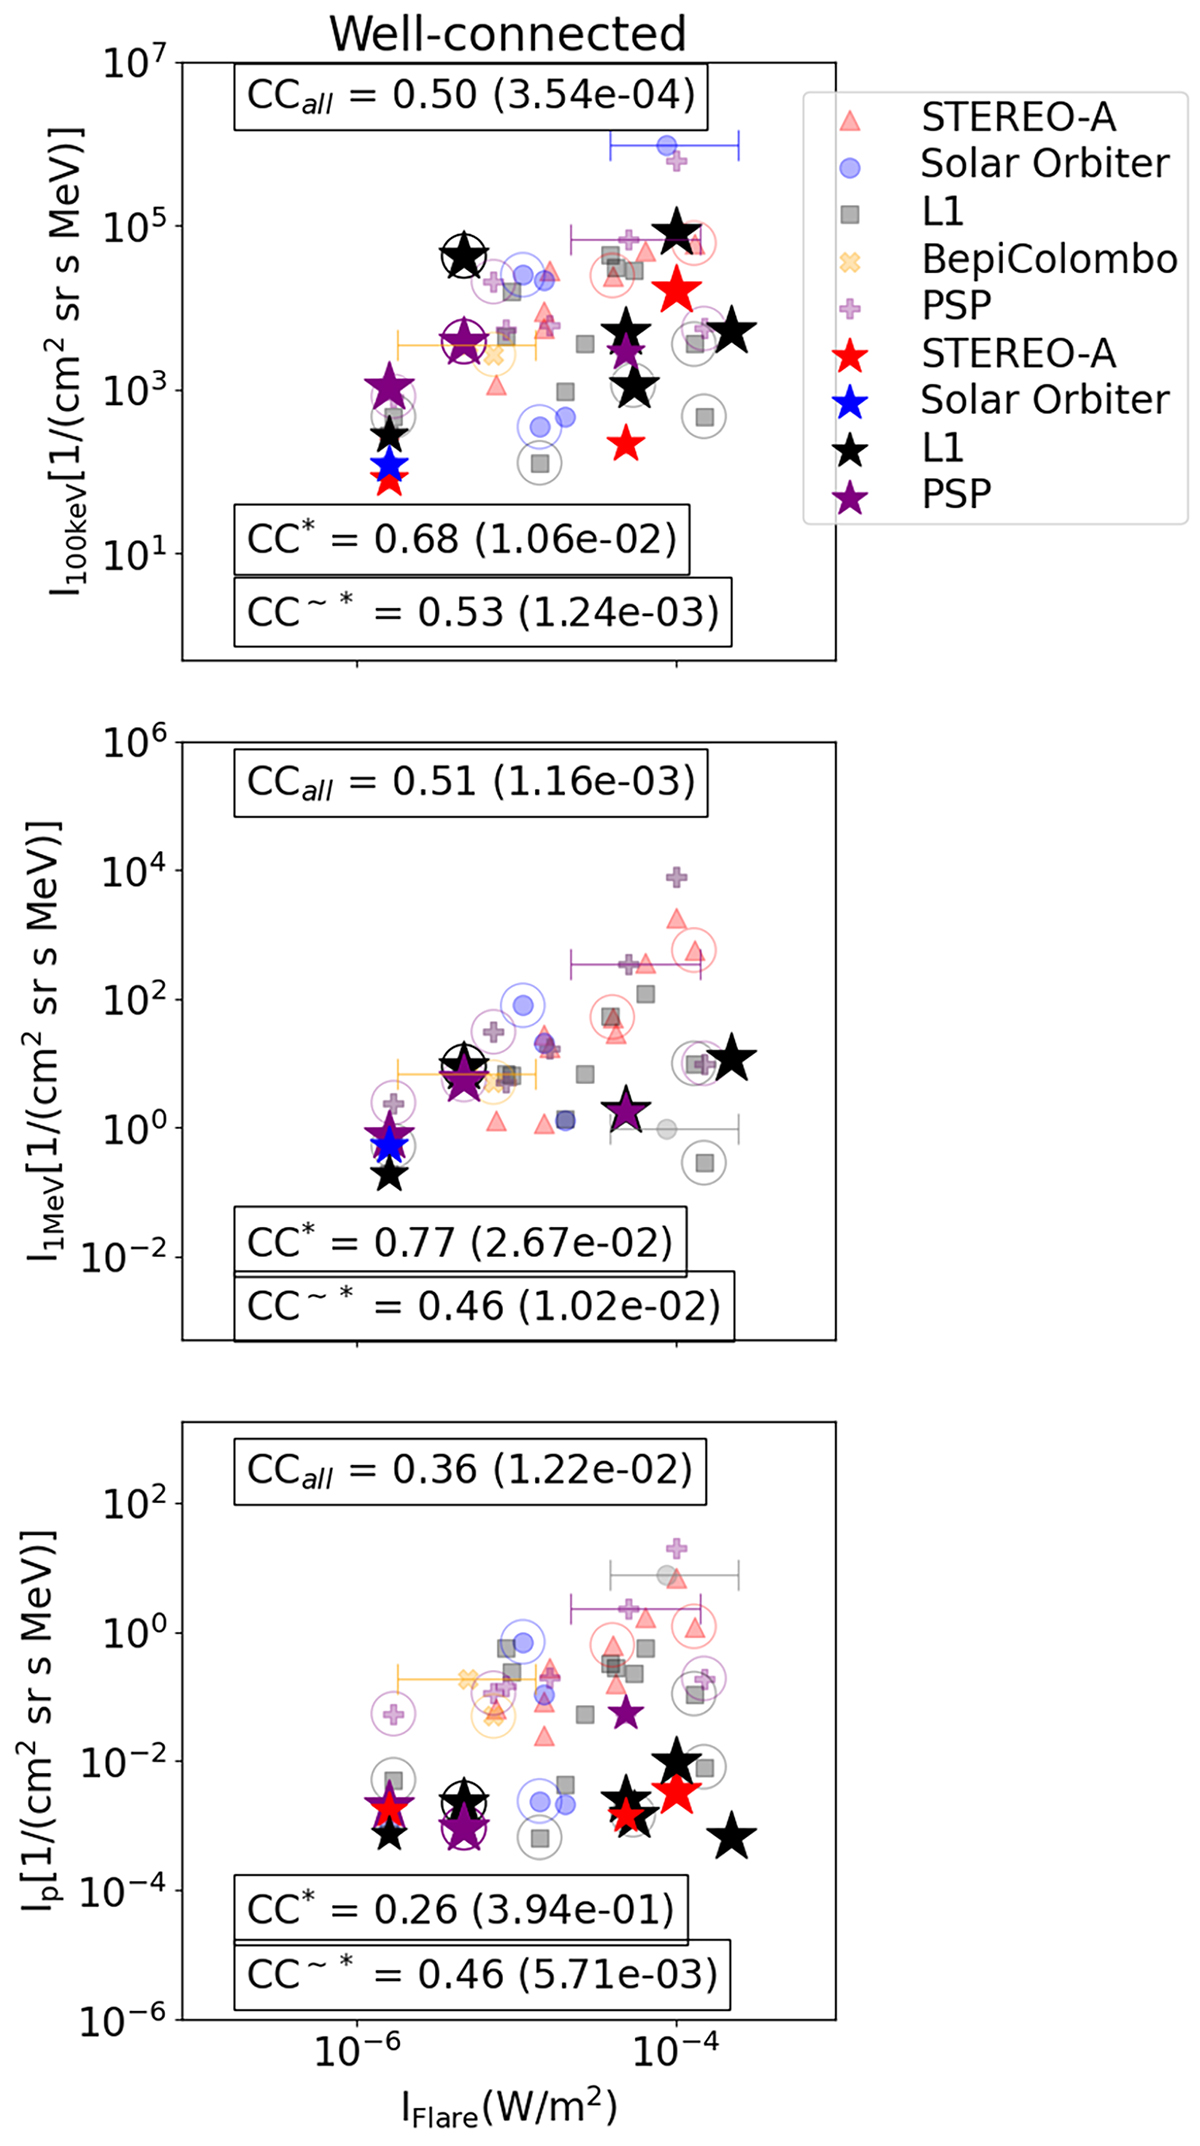
Peak intensities of SEPs as a function of flare intensity for ∼100 keV electrons (top panel), 1 MeV electrons (central panel), and ≥25 MeV protons (bottom panel) for well-connected events. All symbols are the same as in Fig. 7. Large starred points represent some of the observations from a group of six SEP events, standing out from the linear trend, and small starred points represent the observations from the same six events with measurements taken at some other spacecraft, and fit into the linear trend. All the rest of points are represented in lighter colours to highlight the starred points only. CCall and CC∼* are the Spearman correlation coefficients along with the p-value for all the events in the scatter plot, and for the rest of the events, excluding all the starred points, respectively. CC* is the Spearman correlation coefficient along with the p-value considering only the starred (both large and small) points in the well-connected events. Error bars along the x-axis represent the uncertainty in the estimated GOES-equivalent flare intensity in the case of behind-the-limb flares observed by Solar Orbiter/STIX.
Current usage metrics show cumulative count of Article Views (full-text article views including HTML views, PDF and ePub downloads, according to the available data) and Abstracts Views on Vision4Press platform.
Data correspond to usage on the plateform after 2015. The current usage metrics is available 48-96 hours after online publication and is updated daily on week days.
Initial download of the metrics may take a while.