Fig. 3.
Download original image
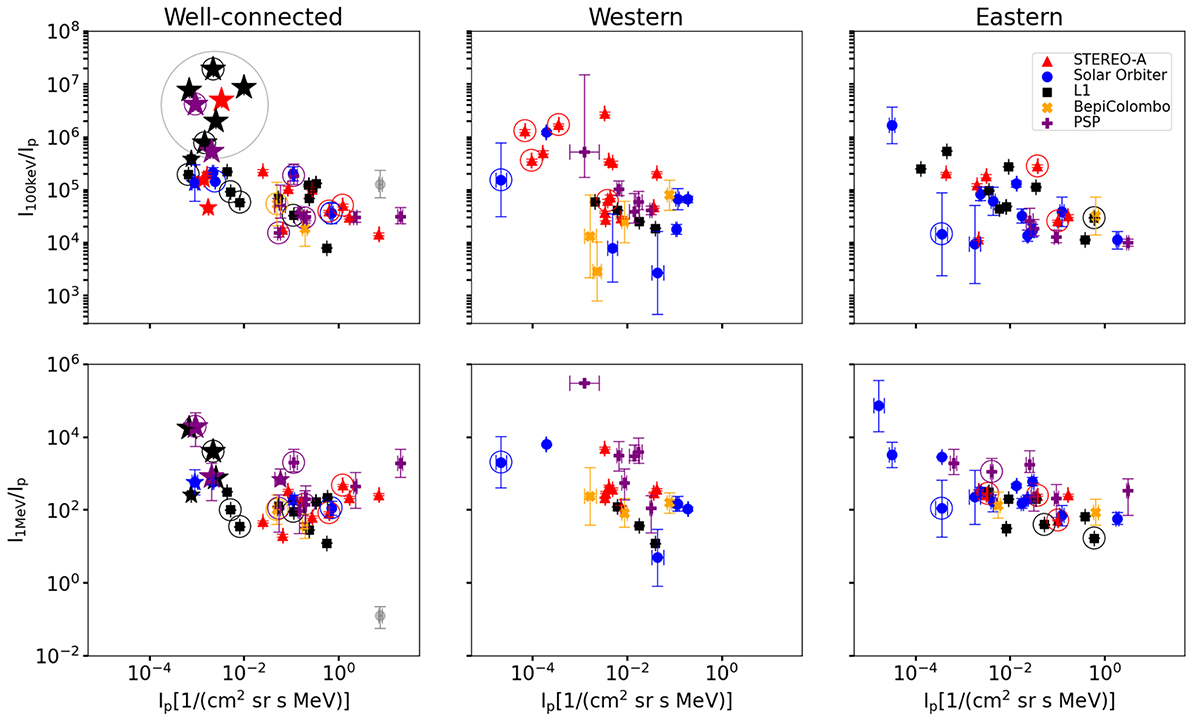
Electron-to-proton peak intensity ratios for ∼100 keV electrons (top panels), and 1 MeV electrons (bottom panels) as a function of peak intensities of ≥25 MeV protons for well-connected (left), western (middle), and eastern (right) events. All symbols are the same as in Fig. 2. Large starred points highlight the group of events with high e/p ratios that lie above the linear trend in Figure 2, while the small starred points that lie on the linear trend represent the observations from same events (large starred points) taken at some other spacecraft.
Current usage metrics show cumulative count of Article Views (full-text article views including HTML views, PDF and ePub downloads, according to the available data) and Abstracts Views on Vision4Press platform.
Data correspond to usage on the plateform after 2015. The current usage metrics is available 48-96 hours after online publication and is updated daily on week days.
Initial download of the metrics may take a while.