Fig. 2.
Download original image
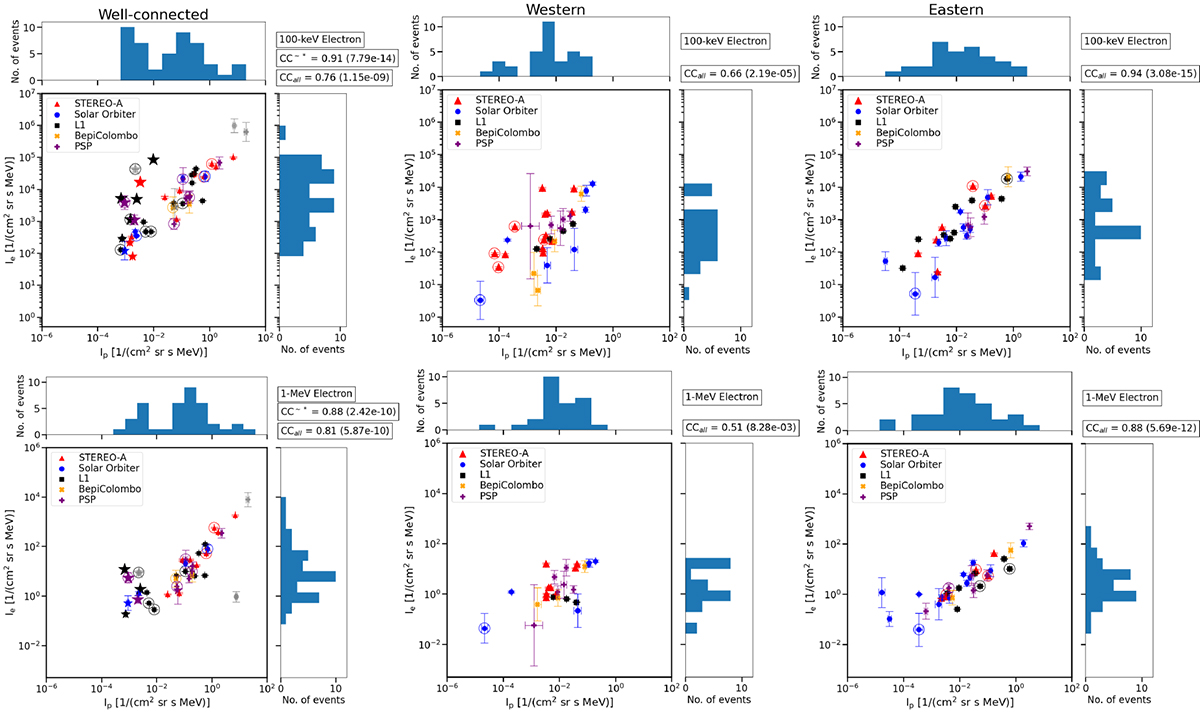
Peak intensities of ∼100 keV electrons (top panels), and 1 MeV electrons (bottom panels) as a function of ≥25 MeV proton peak intensities for well-connected events (left), western events (middle), and eastern events (right). Red triangles, blue circles, black squares, orange crosses, and purple plus symbols indicate the STEREO A, Solar Orbiter, L1, BepiColombo, and PSP observations, respectively. Large starred points following the same colour scheme highlight events that deviate from the linear trend. Small starred points represent the measurements of the same events by other spacecraft that are more consistent with the linear trend. Encircled points indicate events where no DM type II radio burst was reported. Error bars represent the error in heliocentric radial scaling measurements. CCs are provided in the legend boxes with the first value denoting the correlation coefficient, and the second (in parentheses) giving the p-value. For the well-connected events, two CCs are provided: CCall for all the events in the scatter plot, and CC∼* for the rest of the events, excluding the starred (both large and small) points. The histograms along the vertical axes show the distribution of electron peak intensities, and those along the horizontal axes show the distribution of proton peak intensities.
Current usage metrics show cumulative count of Article Views (full-text article views including HTML views, PDF and ePub downloads, according to the available data) and Abstracts Views on Vision4Press platform.
Data correspond to usage on the plateform after 2015. The current usage metrics is available 48-96 hours after online publication and is updated daily on week days.
Initial download of the metrics may take a while.