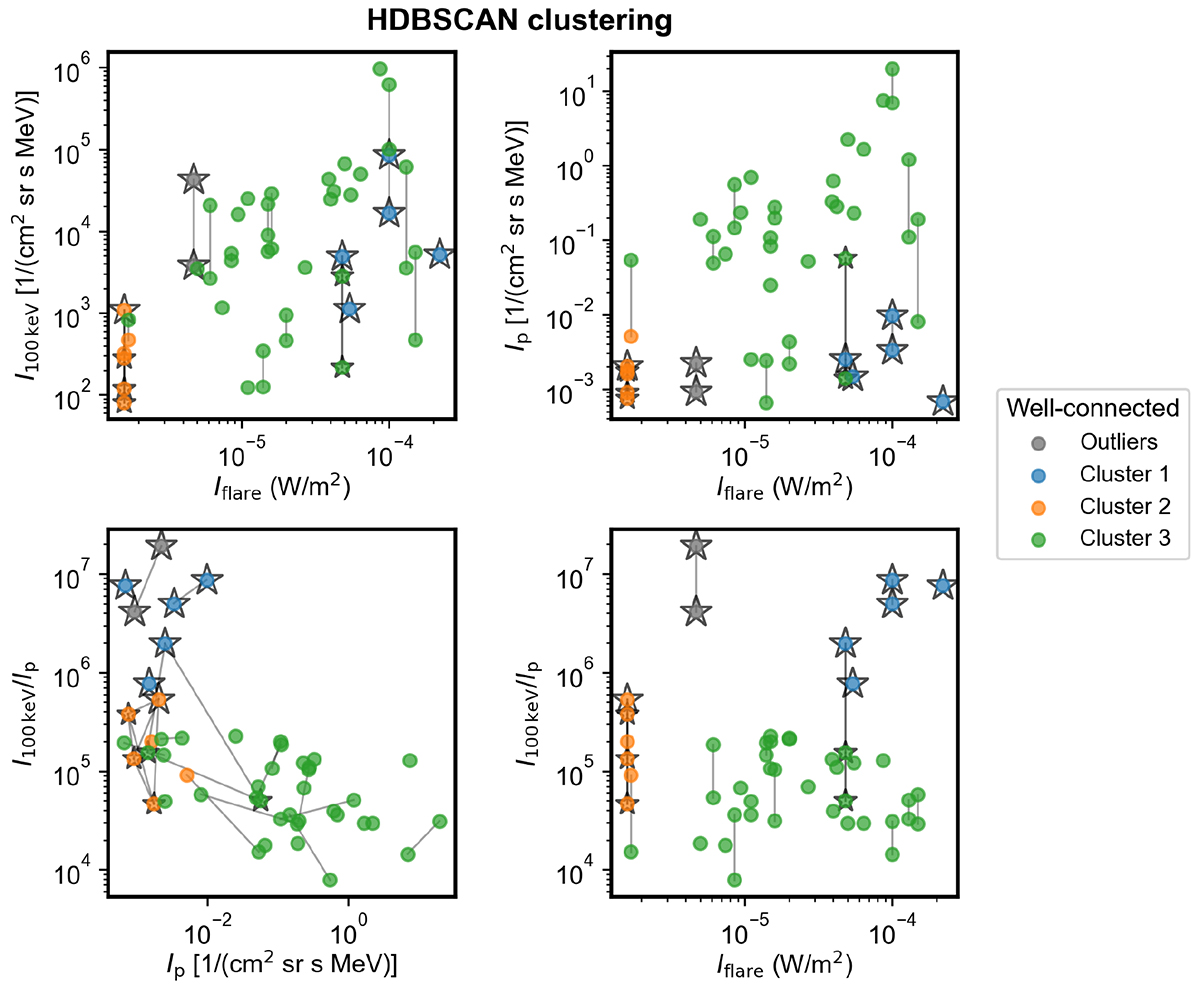
Fig. C.2.
Download original image
Scatter plots of the well-connected events in the recent data set used for this study, as a function of flare intensity for 100 keV electron intensity (top, left), 25 MeV proton intensity (top, right), and 100 keV electron to 25 MeV proton ratio (bottom right), and scatter plot of 100 keV electron to 25 MeV proton ratio versus 25 MeV proton intensity (bottom left). The observations are colour-coded according to the results of the HDBSCAN clustering analysis. The grey points denote points that the algorithm deemed as outlier points. The lines connect observations associated with the same flare.
Current usage metrics show cumulative count of Article Views (full-text article views including HTML views, PDF and ePub downloads, according to the available data) and Abstracts Views on Vision4Press platform.
Data correspond to usage on the plateform after 2015. The current usage metrics is available 48-96 hours after online publication and is updated daily on week days.
Initial download of the metrics may take a while.