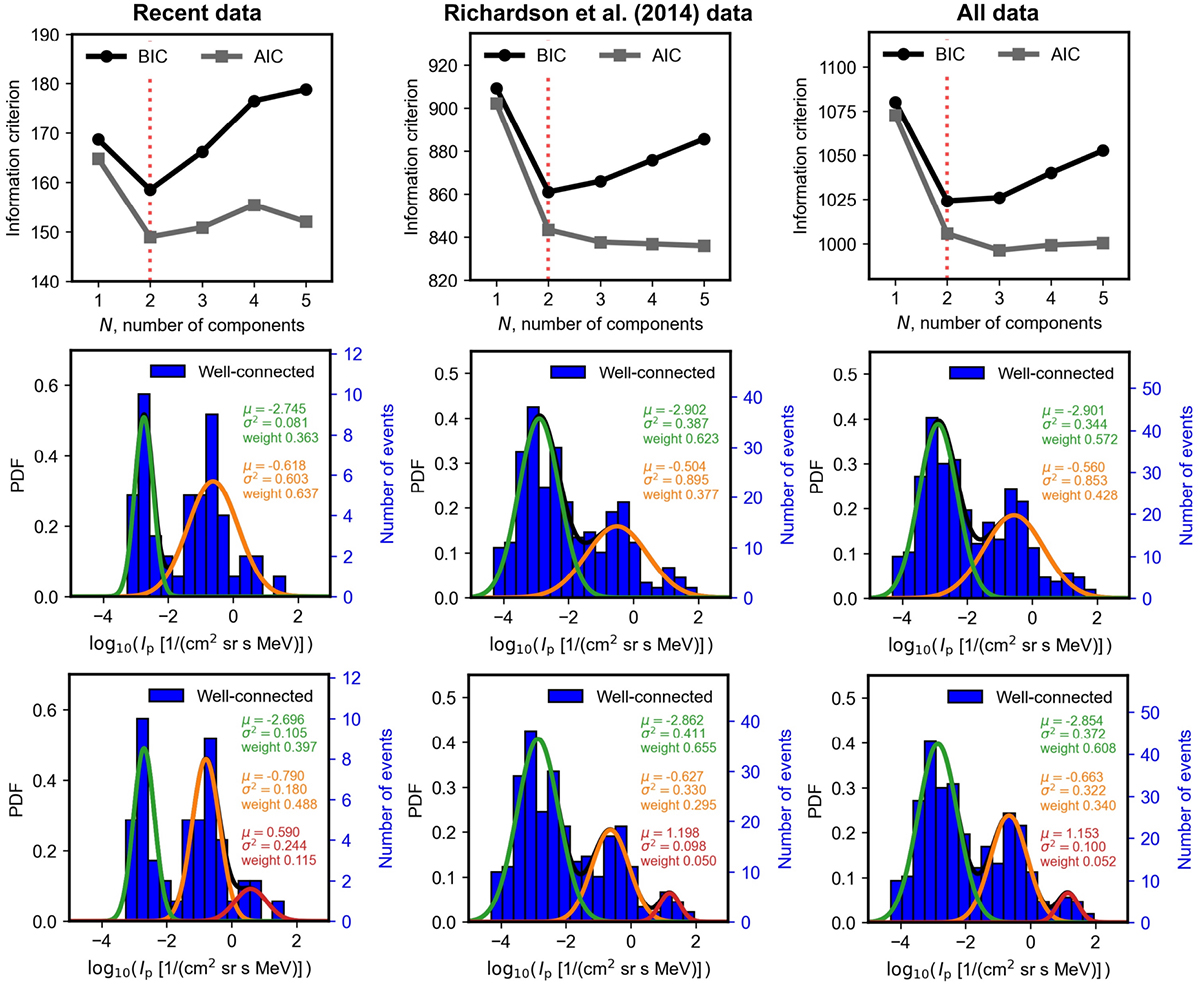
Fig. C.1.
Download original image
Results of Gaussian Mixture models for: the recent data used for this study (left column), the data set of Richardson et al. (2014) (middle column), and all data (combining both) (right column). The top row shows the BIC and AIC for models of N components, and the red dotted vertical line denotes the N that minimises BIC. The middle row shows the GMM results for N = 2 and the bottom row shows the results for N = 3.
Current usage metrics show cumulative count of Article Views (full-text article views including HTML views, PDF and ePub downloads, according to the available data) and Abstracts Views on Vision4Press platform.
Data correspond to usage on the plateform after 2015. The current usage metrics is available 48-96 hours after online publication and is updated daily on week days.
Initial download of the metrics may take a while.