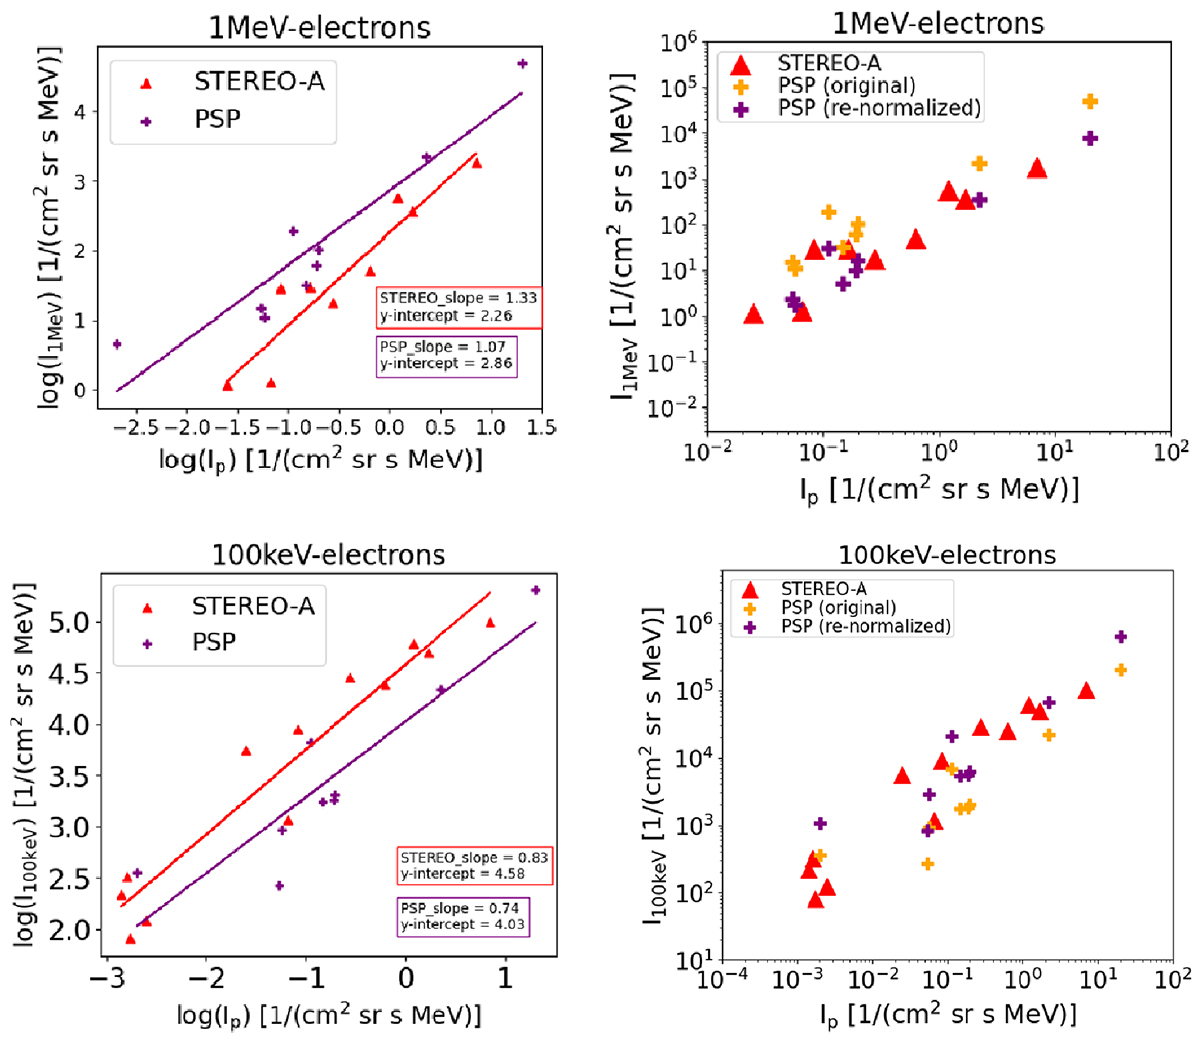
Fig. B.3.
Download original image
Re-normalization applied to PSP measurements for 1 MeV (top panel) and ∼100 keV (lower panel) electrons. The left panel shows the fits applied to STEREO A and PSP data points, for 1 MeV (top panel) and ∼100 keV (lower panel) electrons. The right panel shows the results of PSP re-normalization applied to 1 MeV (top panel) and ∼100 keV (lower panel) electrons. In the right panel, orange and purple plus markers represent the PSP data points before and after the re-normalization, respectively.
Current usage metrics show cumulative count of Article Views (full-text article views including HTML views, PDF and ePub downloads, according to the available data) and Abstracts Views on Vision4Press platform.
Data correspond to usage on the plateform after 2015. The current usage metrics is available 48-96 hours after online publication and is updated daily on week days.
Initial download of the metrics may take a while.