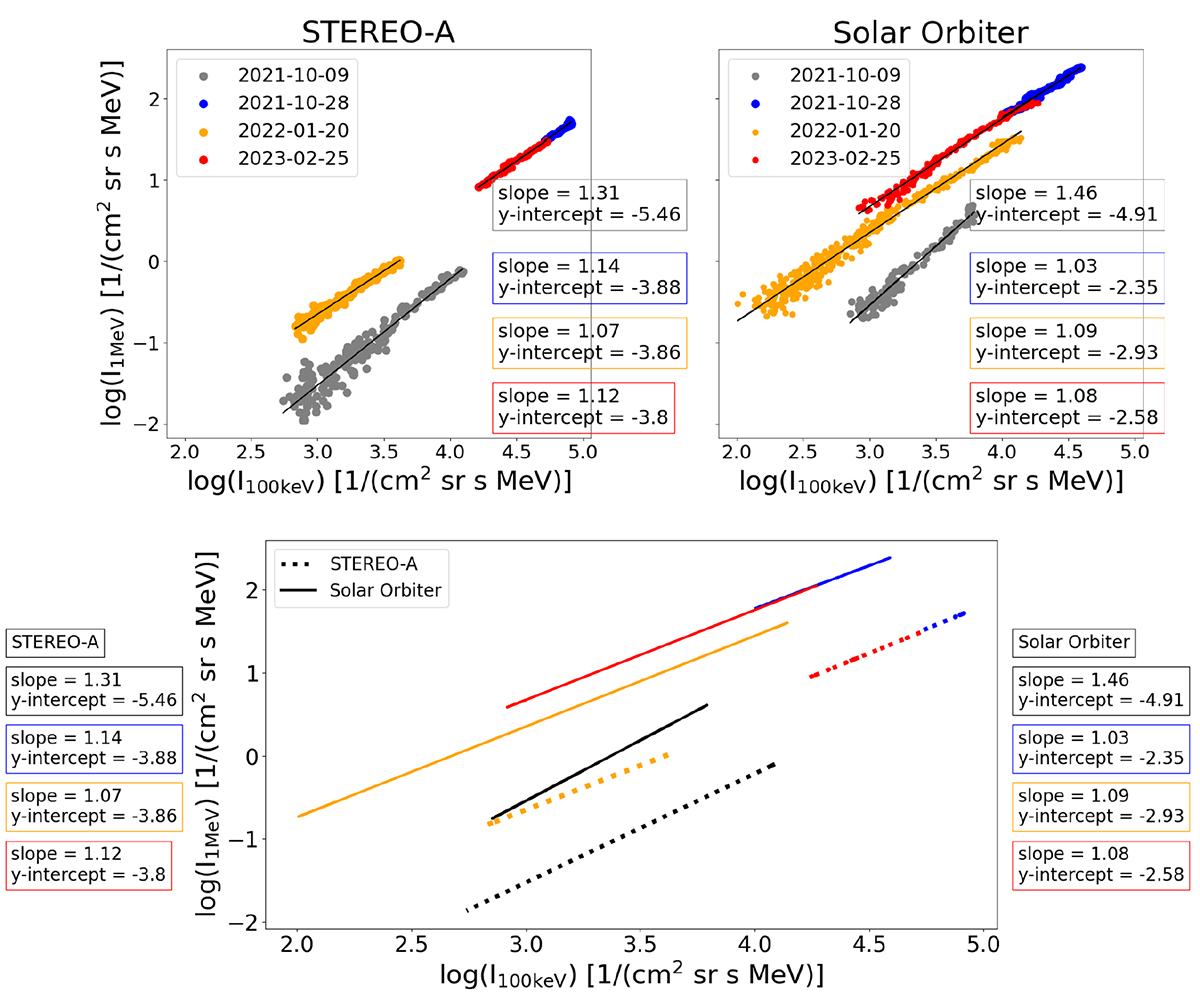
Fig. B.1.
Download original image
Peak intensities of 1 MeV electrons versus peak intensities of ∼100 keV electrons measured at STEREO A/SEPT & HET (top-left) and Solar Orbiter/EPT & HET (top-right) for four commonly observed events at both spacecraft. Legend boxes with corresponding colours have the values of slope and y-intercept for each fit on the scatter plots. The lower panel shows fits for the events observed by both spacecraft, with solid and dotted lines representing Solar Orbiter and STEREO A observations, respectively.
Current usage metrics show cumulative count of Article Views (full-text article views including HTML views, PDF and ePub downloads, according to the available data) and Abstracts Views on Vision4Press platform.
Data correspond to usage on the plateform after 2015. The current usage metrics is available 48-96 hours after online publication and is updated daily on week days.
Initial download of the metrics may take a while.