Fig. 12.
Download original image
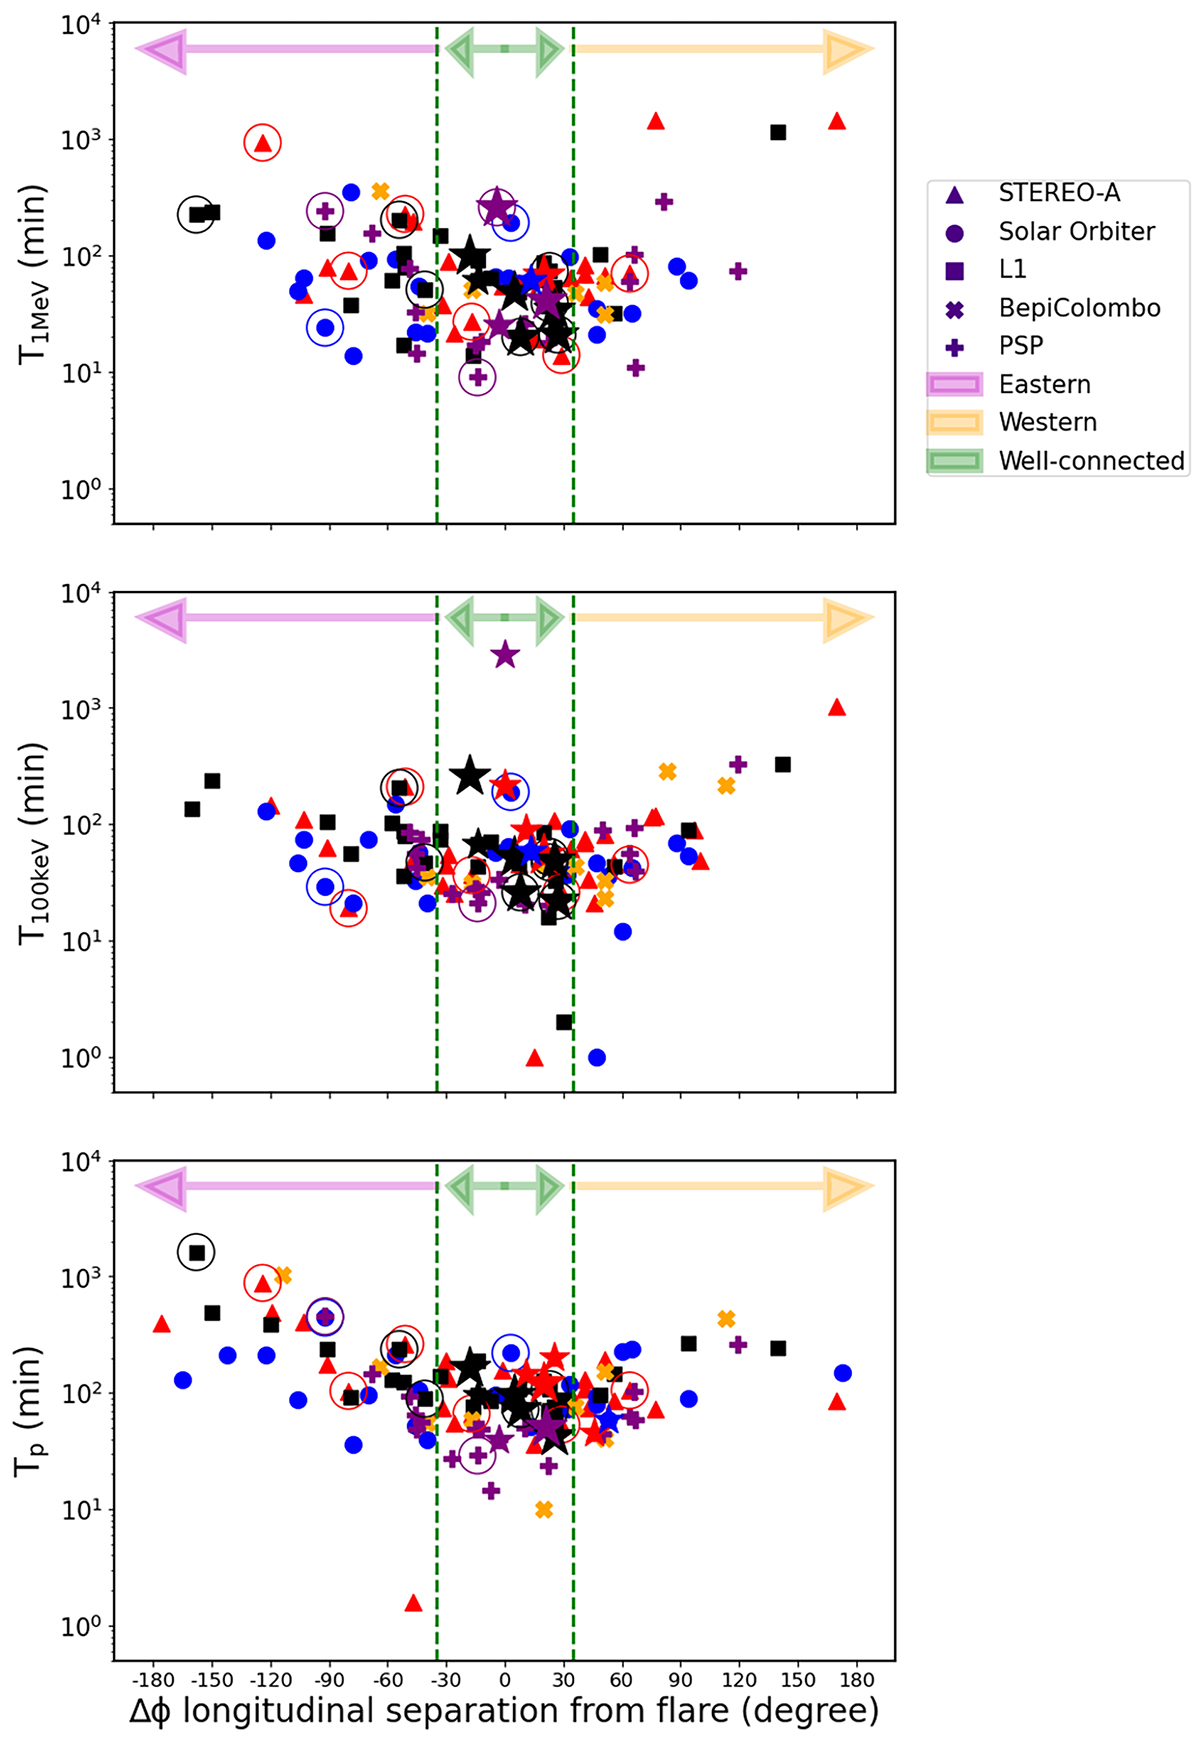
Variation of the onset delay time of SEP events from flare onset with respect to the longitudinal separation ΔΦ of the observer’s field line footpoint from the flare location for 1 MeV electrons (top panel), ∼100 keV electrons (central panel), and ≥25 MeV protons (bottom panel). All symbols are the same as in Fig. 2. Green, orange, and pink arrows represent the sectors of well-connected and poorly connected western and eastern events, respectively.
Current usage metrics show cumulative count of Article Views (full-text article views including HTML views, PDF and ePub downloads, according to the available data) and Abstracts Views on Vision4Press platform.
Data correspond to usage on the plateform after 2015. The current usage metrics is available 48-96 hours after online publication and is updated daily on week days.
Initial download of the metrics may take a while.