Fig. 11.
Download original image
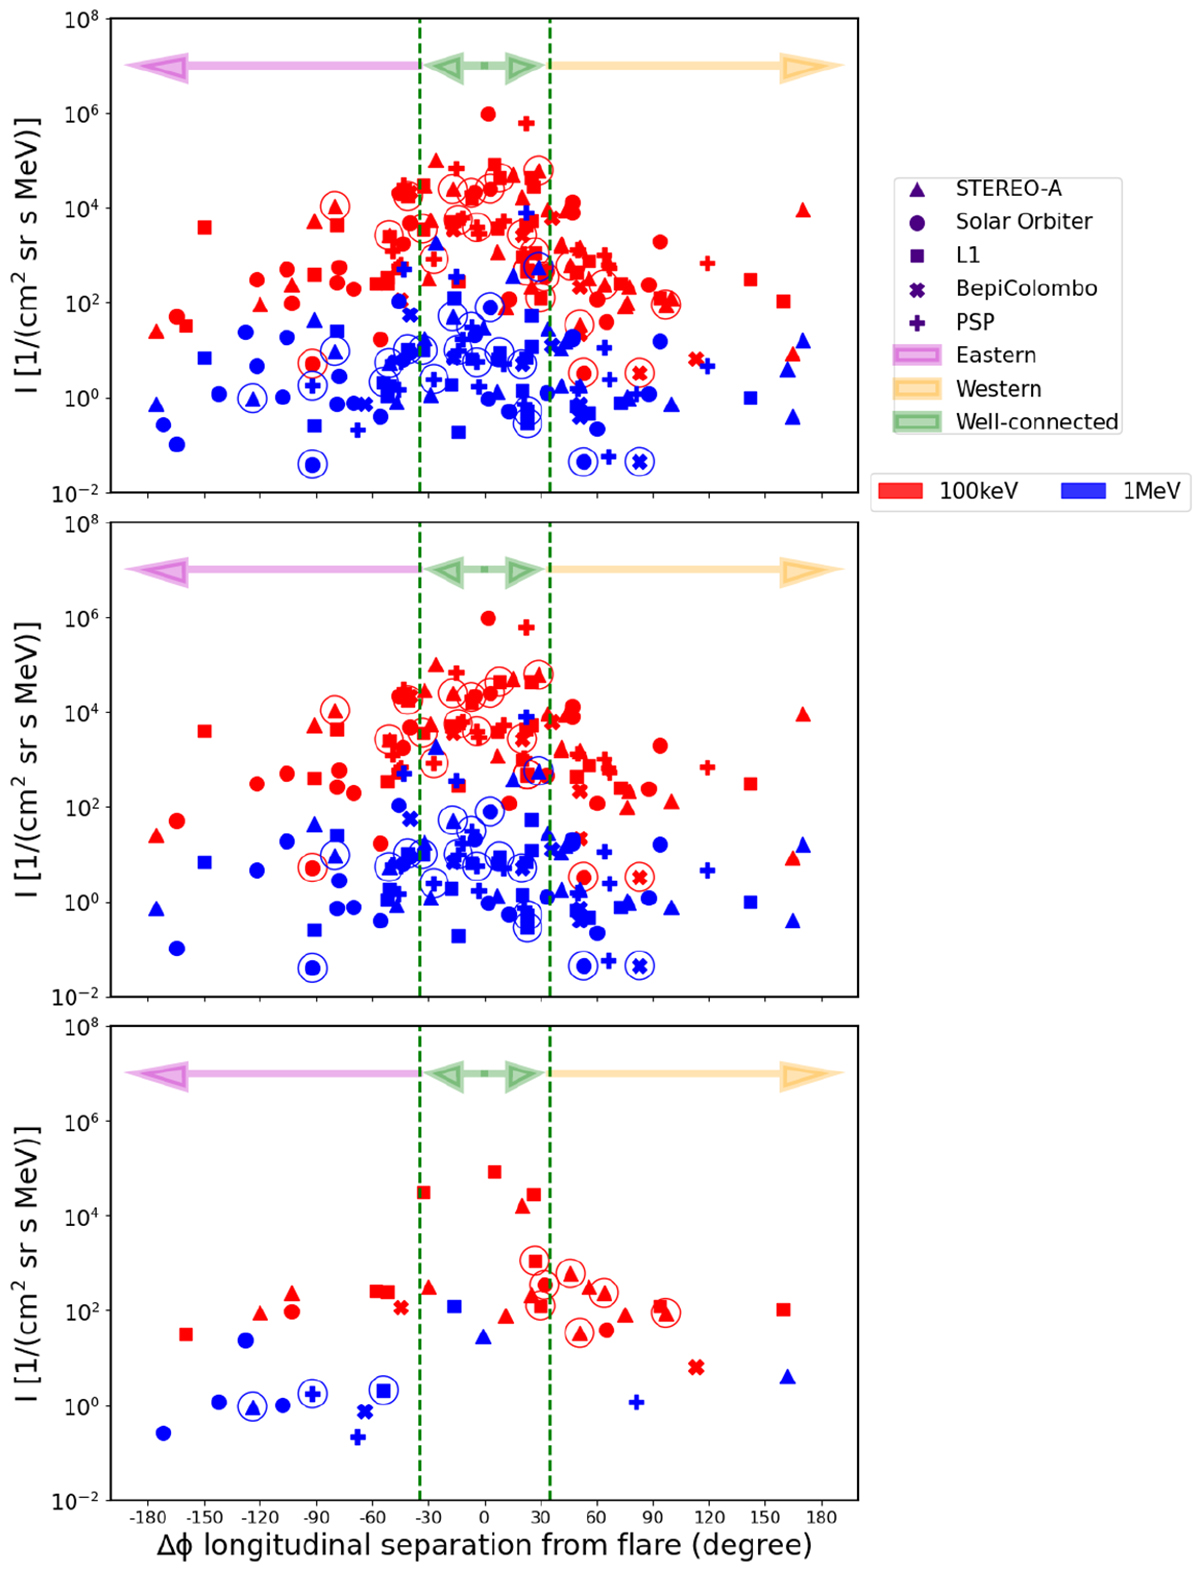
Electron peak intensities for both electron energies, that is, ∼100 keV (red symbols) and 1 MeV electrons (blue symbols), as a function of the longitudinal separation angle ΔΦ. The green, orange, and pink arrows indicate the sectors of well-connected, western, and eastern events, respectively. The top panel includes all events observed at any of the two electron energies. The central panel shows those events simultaneously observed at both electron energies, while those events only observed at one of the two energies (∼100 keV and 1 MeV) are displayed in the bottom panel.
Current usage metrics show cumulative count of Article Views (full-text article views including HTML views, PDF and ePub downloads, according to the available data) and Abstracts Views on Vision4Press platform.
Data correspond to usage on the plateform after 2015. The current usage metrics is available 48-96 hours after online publication and is updated daily on week days.
Initial download of the metrics may take a while.