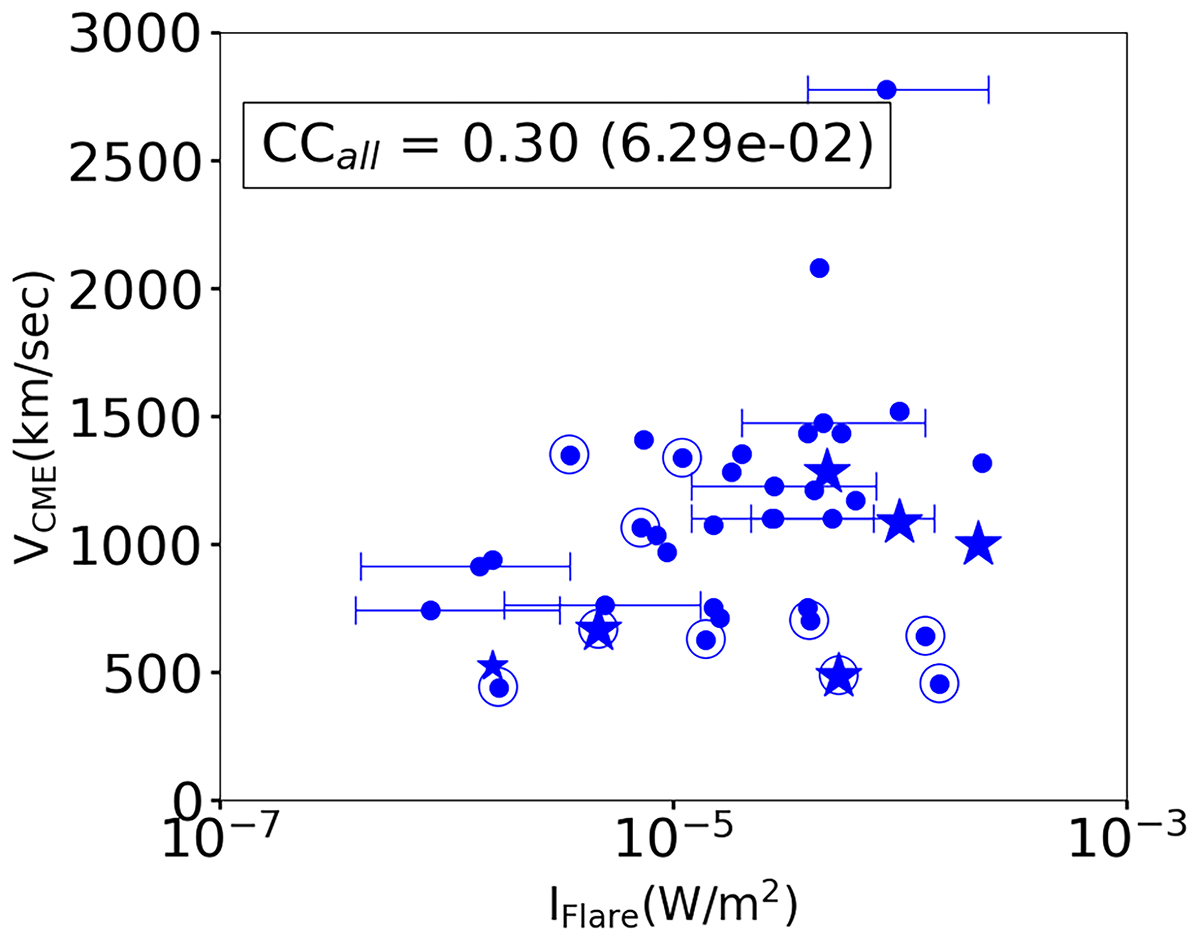
Fig. 10.
Download original image
Variation of the projected linear CME speed as compared to the flare intensity. Large starred points represent the group of events with high e/p ratios that deviate from the linear trend in blue Fig. 2, and small starred points represent the same events observed at other locations that lie on the linear trend in Fig. 2. Encircled points represent events where no DM radio type II burst is reported. Error bars along the x-axis represent the uncertainty in the estimated GOES-equivalent flare intensity in the case of behind-the-limb flares observed by Solar Orbiter/STIX. CCall displays the correlation coefficient of all the points marked by symbols (not taking into account the error bars).
Current usage metrics show cumulative count of Article Views (full-text article views including HTML views, PDF and ePub downloads, according to the available data) and Abstracts Views on Vision4Press platform.
Data correspond to usage on the plateform after 2015. The current usage metrics is available 48-96 hours after online publication and is updated daily on week days.
Initial download of the metrics may take a while.