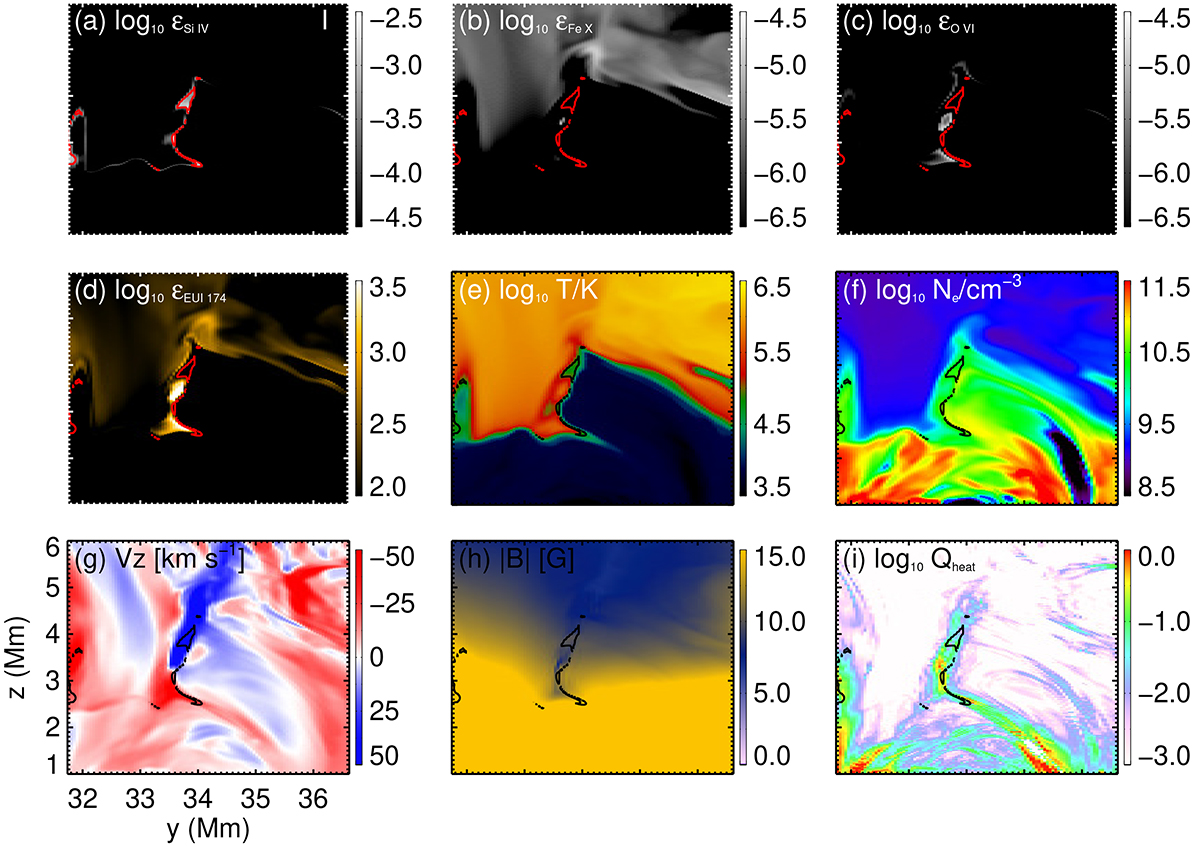
Fig. 9.
Download original image
Vertical cuts of (a) Si IV emission, (b) Fe X emission, (c) O VI emission, (d) EUI 174 Å emission, (e) temperature, (f) electron number density, (g) vertical velocity, (h) magnetic field strength, and (i) heating rates (sum of viscous and Joule heating) along the red dashed line through Event 1 shown in Fig. 3. The emissions are shown in arbitrary units. The contours outline the regions with enhanced Si IV emission. See Sect. 3.3.
Current usage metrics show cumulative count of Article Views (full-text article views including HTML views, PDF and ePub downloads, according to the available data) and Abstracts Views on Vision4Press platform.
Data correspond to usage on the plateform after 2015. The current usage metrics is available 48-96 hours after online publication and is updated daily on week days.
Initial download of the metrics may take a while.