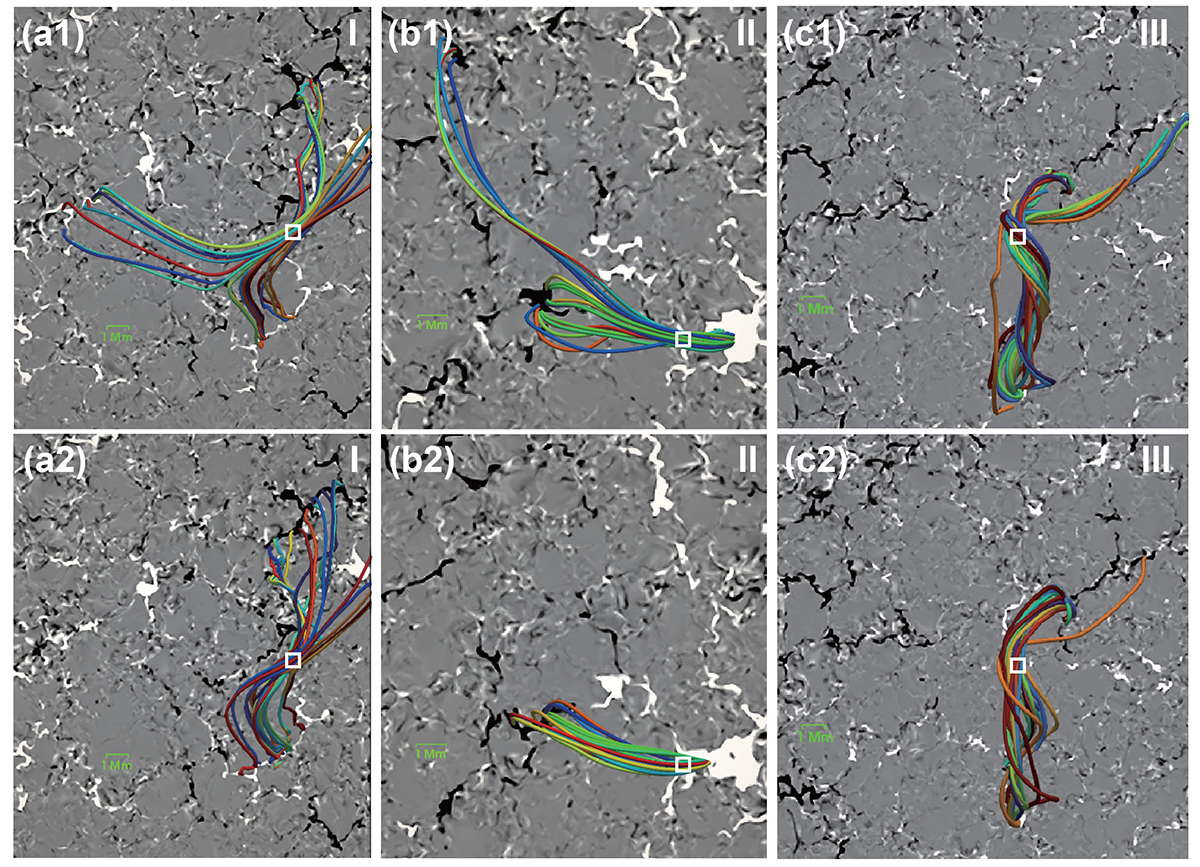
Fig. 8.
Download original image
Magnetic field structure evolution. (a1) Background showing a zoomed-in view of the vertical magnetic field in the photosphere. The magnetogram saturates at ±350 G. The curves represent the magnetic field lines passing through Event 1. The corresponding time is the same as in Fig. 3. (a2) Similar to (a1), but for the magnetogram and magnetic field lines one minute later. The white boxes indicate the location of the event. (b1) and (b2) Similar to (a1) and (a2), but for Event 2. The time difference of the two panels is 9 min. Reproduced from Chen et al. (2021). (c1) and (c2) Similar to (a1) and (a2), but for Event 3. The field of view for all panels represents a small part of the overall calculation domain. See Sect. 3.2.
Current usage metrics show cumulative count of Article Views (full-text article views including HTML views, PDF and ePub downloads, according to the available data) and Abstracts Views on Vision4Press platform.
Data correspond to usage on the plateform after 2015. The current usage metrics is available 48-96 hours after online publication and is updated daily on week days.
Initial download of the metrics may take a while.