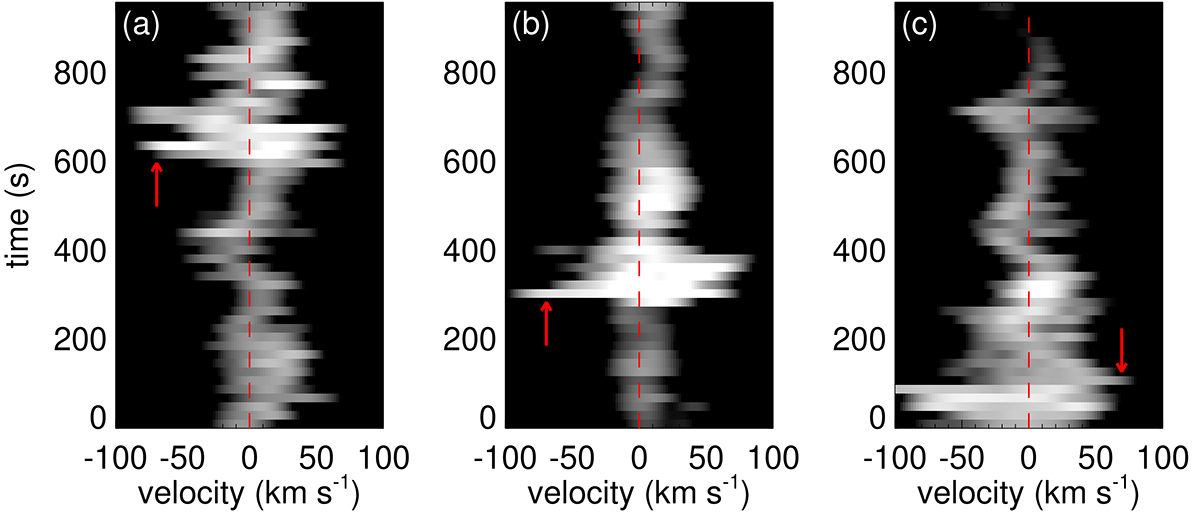
Fig. 7.
Download original image
Temporal evolution of the Si IV line profiles. (a) Temporal evolution of the Si IV line profile within the blue box at Event 1 shown in Fig. 3a. The vertical dashed red line represents zero shift. The red arrow points to the moment shown in Fig. 3. (b) Similar to (a), but for Event 2 shown in Fig. 4. (c) Similar to (a), but for Event 3 shown in Fig. 5. See Sect. 3.1.
Current usage metrics show cumulative count of Article Views (full-text article views including HTML views, PDF and ePub downloads, according to the available data) and Abstracts Views on Vision4Press platform.
Data correspond to usage on the plateform after 2015. The current usage metrics is available 48-96 hours after online publication and is updated daily on week days.
Initial download of the metrics may take a while.