Fig. 3.
Download original image
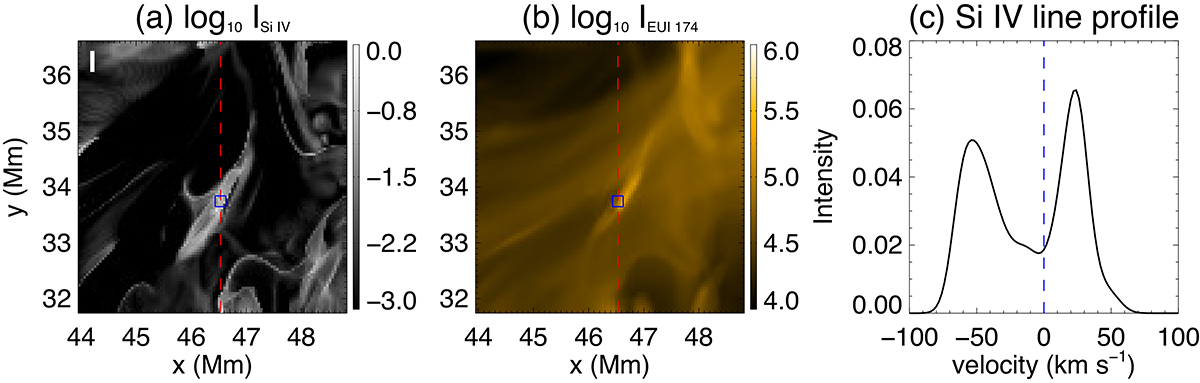
Intensity maps and the Si IV line profile for Event 1. (a) Intensity map of the Si IV 1394 Å line. (b) Synthesized emission in EUI 174 Å passband. (c) Degraded Si IV line profile at the blue box shown in panels a and b. The size of the blue box is ∼240 km. The intensity is shown in arbitrary units. The vertical dashed blue line represents zero shift. See Sect. 3.1.
Current usage metrics show cumulative count of Article Views (full-text article views including HTML views, PDF and ePub downloads, according to the available data) and Abstracts Views on Vision4Press platform.
Data correspond to usage on the plateform after 2015. The current usage metrics is available 48-96 hours after online publication and is updated daily on week days.
Initial download of the metrics may take a while.