Open Access
Fig. 2.
Download original image
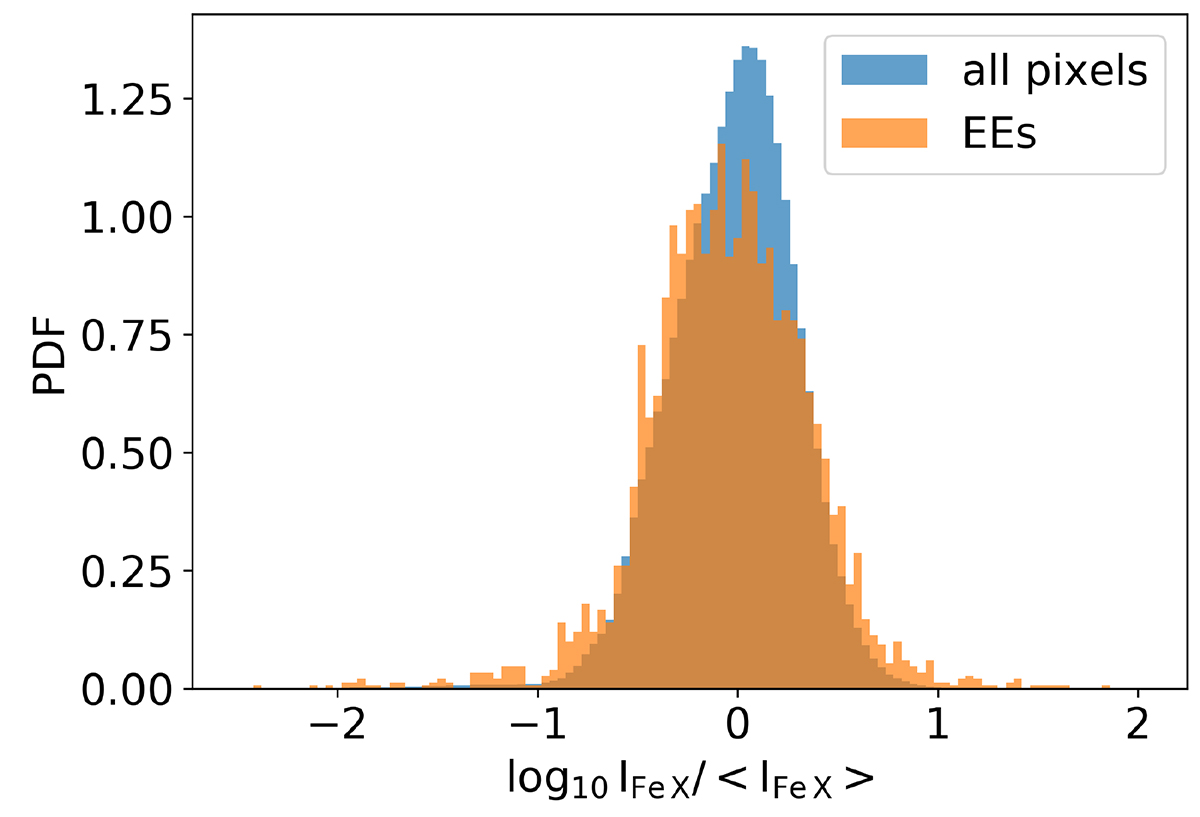
Probability density function (PDF) of the Fe X line intensity for all pixels (in blue) and those identified as explosive events (in orange). ⟨IFe X⟩ represents the average intensity of the Fe X line across all pixels. See Sect. 2.
Current usage metrics show cumulative count of Article Views (full-text article views including HTML views, PDF and ePub downloads, according to the available data) and Abstracts Views on Vision4Press platform.
Data correspond to usage on the plateform after 2015. The current usage metrics is available 48-96 hours after online publication and is updated daily on week days.
Initial download of the metrics may take a while.