Fig. 12.
Download original image
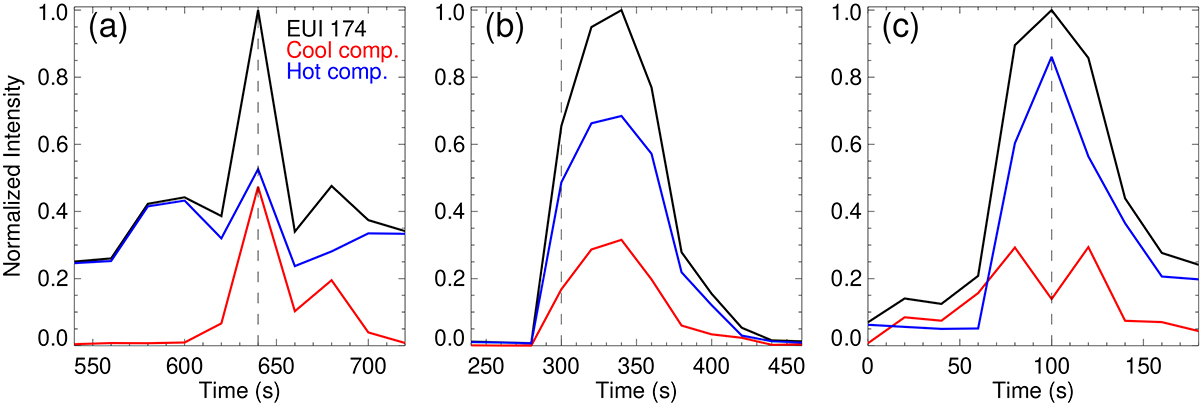
Light curves of Event 1. (a) Intensity variations of EUI 174 Å passband in Event 1. The black solid curves represent the intensity variations of synthesized EUI 174 Å emission within the blue box shown in Fig. 3. The blue and red curves represent the cool and hot components, respectively. (b) and (c) Similar to (a), but for Events 2 and 3 shown in Figs. 4 and 5, respectively. For each panel, the three light curves are normalized by the maximum value of the black curve. The vertical black dashed lines represent the time of the snapshots shown in Figs. 3, 4, and 5, respectively. See Sect. 4.
Current usage metrics show cumulative count of Article Views (full-text article views including HTML views, PDF and ePub downloads, according to the available data) and Abstracts Views on Vision4Press platform.
Data correspond to usage on the plateform after 2015. The current usage metrics is available 48-96 hours after online publication and is updated daily on week days.
Initial download of the metrics may take a while.