Open Access
Fig. 1.
Download original image
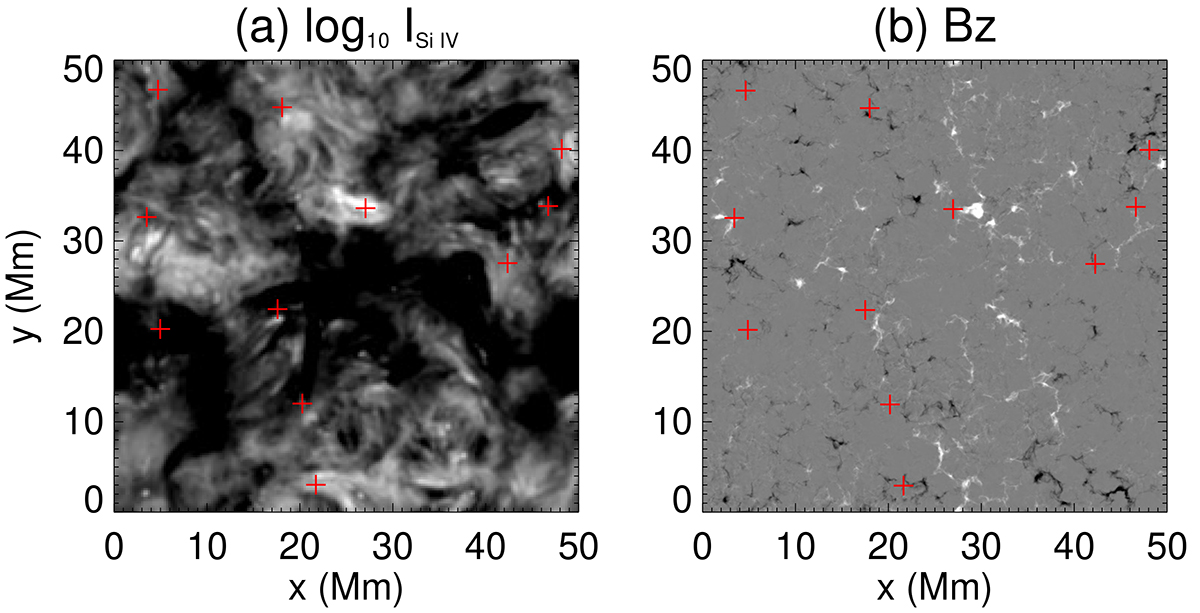
Locations of the selected events. (a) Intensity map of the Si IV line integrated over 16 minutes. (b) Magnetogram averaged over 16 minutes, saturated at ±1000 G. The red crosses in (a) and (b) indicate the locations of the selected events. See Sect. 2.
Current usage metrics show cumulative count of Article Views (full-text article views including HTML views, PDF and ePub downloads, according to the available data) and Abstracts Views on Vision4Press platform.
Data correspond to usage on the plateform after 2015. The current usage metrics is available 48-96 hours after online publication and is updated daily on week days.
Initial download of the metrics may take a while.