Fig. 8.
Download original image
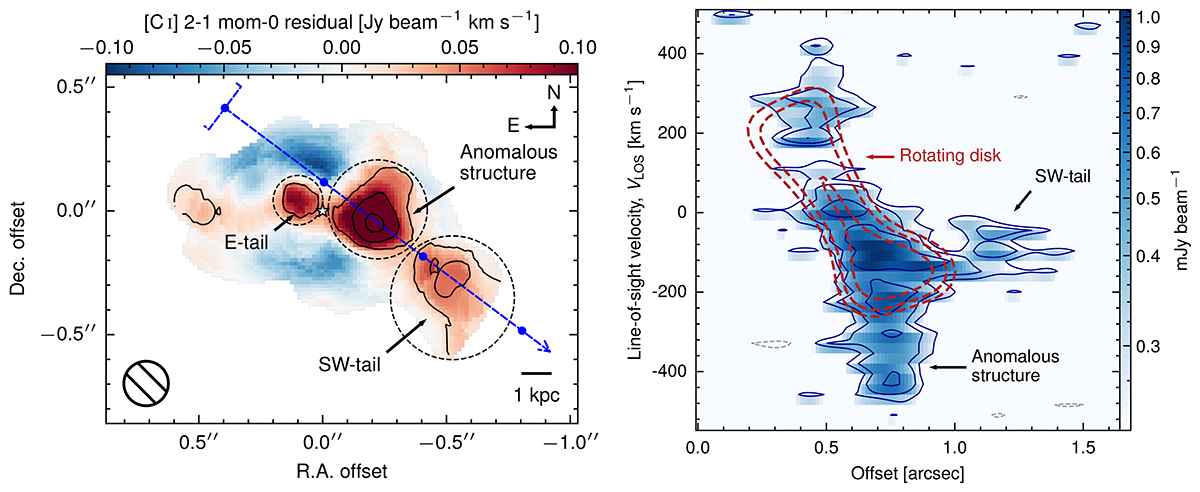
Non-circular motions of PKS 0529–549. Left: Residual [C I] (2−1) map obtained by subtracting the best-fit rotating-disk model from the observed moment-0 map. The synthesized beam of the [C I] data is shown in the lower left corner. The axis coordinates are relative to the kinematic center (white star). The dashed circles show the aperture for measuring the flux of the enclosed structures. The black contours correspond to S/N = 3 × (1, 2, 3) of the residual map. The dashed blue arrow indicates the path for extracting the PV diagram on the right. The upper left end of the arrow indicates the width of the path. The dotted blue ticks indicate offsets of 0.0 arcsec, 0.5 arcsec, 1.0 arcsec, and 1.5 arcsec along the path. Right: Position-velocity diagram along the path on the left. The color-coding and the contour levels are the same as those in Fig. 5.
Current usage metrics show cumulative count of Article Views (full-text article views including HTML views, PDF and ePub downloads, according to the available data) and Abstracts Views on Vision4Press platform.
Data correspond to usage on the plateform after 2015. The current usage metrics is available 48-96 hours after online publication and is updated daily on week days.
Initial download of the metrics may take a while.