Fig. 7.
Download original image
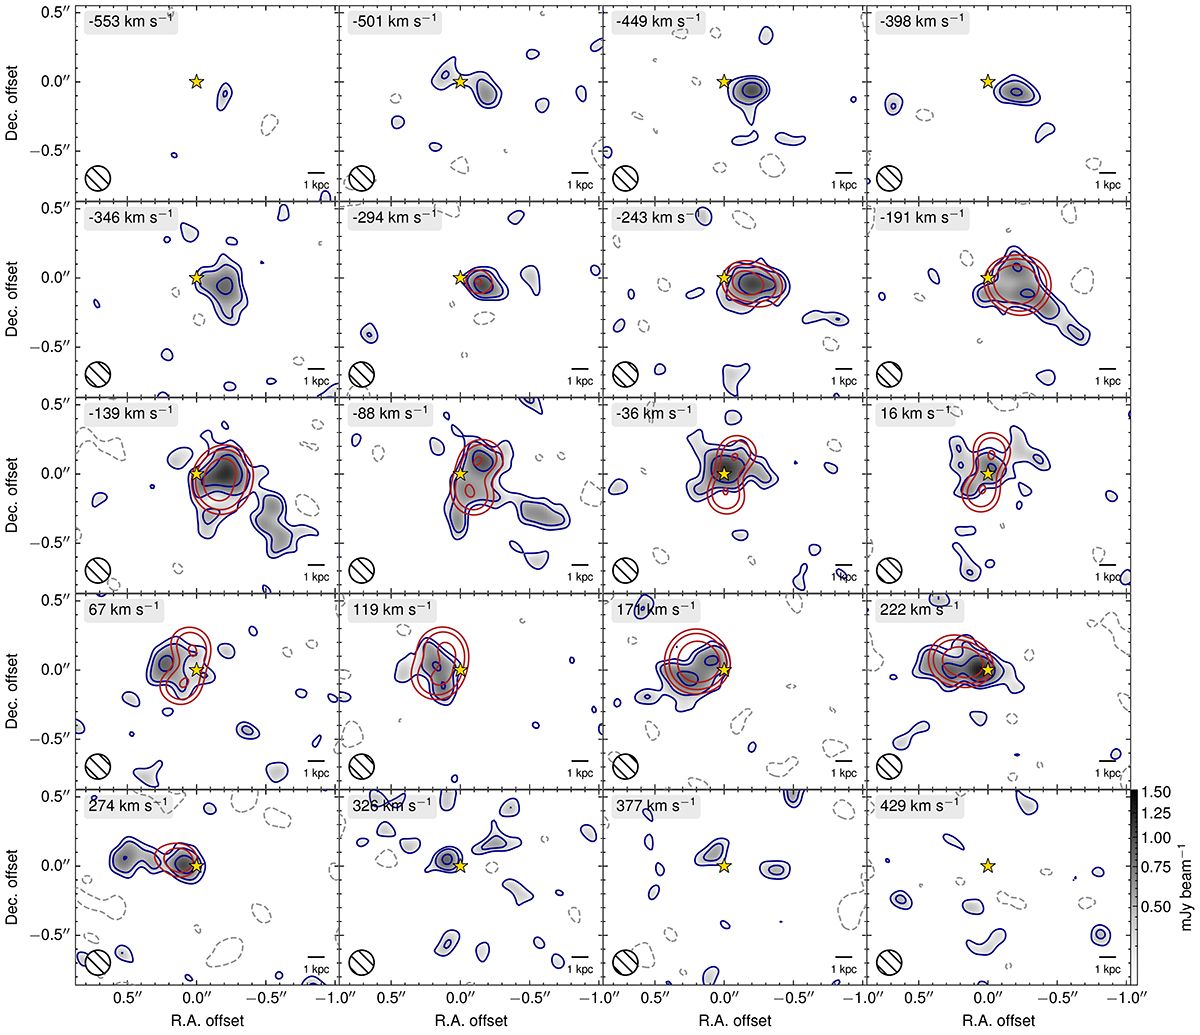
Channel maps of the [C I] (2−1) cube, showing every other channel. The grayscale and the blue contours show the observed [C I] (2−1) data. The red contours show the best-fit rotating-disk model (Section 4). The contour levels are at S/N = ( ± 2, 3, 5), and negative contours are shown with dashed gray lines. The axis coordinates are relative to the kinematic center (golden star). The line-of-sight velocities are relative to the redshift of the [C I] (2−1) line. The synthesized beam of the [C I] (2−1) cube is shown in the bottom left corner of each panel.
Current usage metrics show cumulative count of Article Views (full-text article views including HTML views, PDF and ePub downloads, according to the available data) and Abstracts Views on Vision4Press platform.
Data correspond to usage on the plateform after 2015. The current usage metrics is available 48-96 hours after online publication and is updated daily on week days.
Initial download of the metrics may take a while.