Open Access
Fig. 6.
Download original image
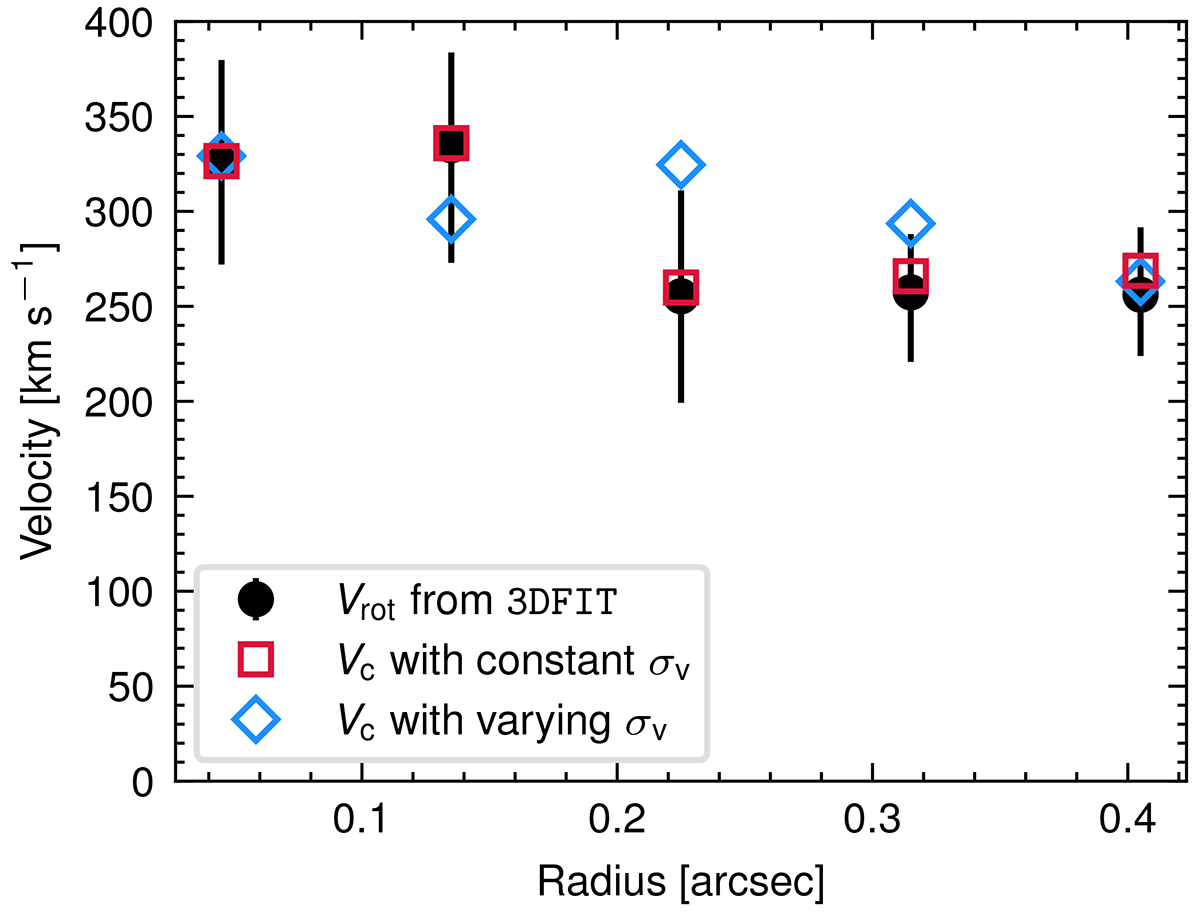
Circular-velocity curve of PKS 0529–549 after correcting for pressure support. The black dots with error bars show the observed rotation velocity from 3DFIT. The red squares and the blue diamonds show the circular velocities after asymmetric drift correction assuming a constant σv and a radially varying σv, respectively.
Current usage metrics show cumulative count of Article Views (full-text article views including HTML views, PDF and ePub downloads, according to the available data) and Abstracts Views on Vision4Press platform.
Data correspond to usage on the plateform after 2015. The current usage metrics is available 48-96 hours after online publication and is updated daily on week days.
Initial download of the metrics may take a while.