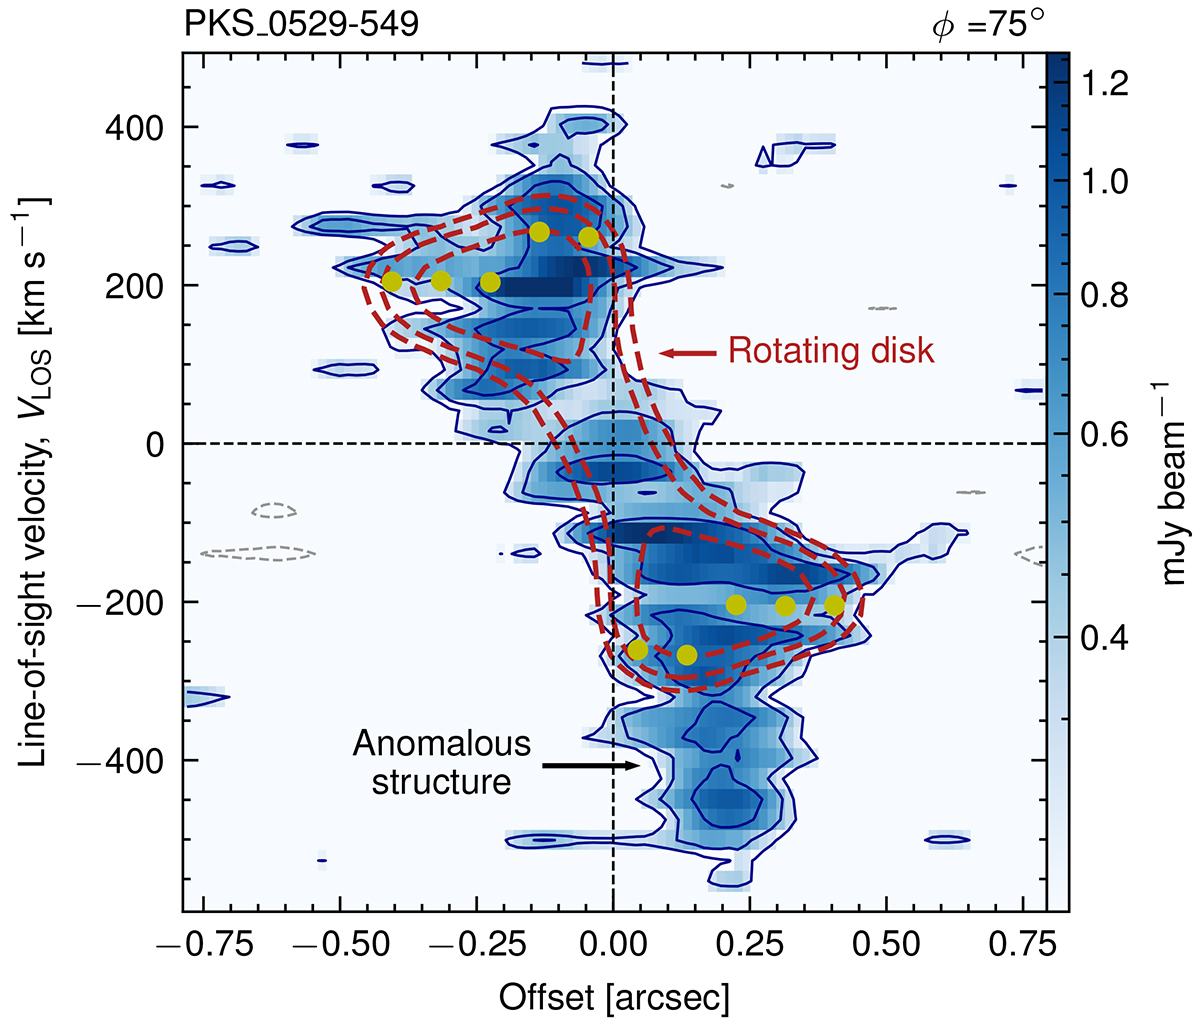
Fig. 5.
Download original image
Position-velocity diagram along the kinematic major axis. The systemic velocity of the rotating disk is set at VLOS = 0 km s−1. The color scale and the blue contours show the observed [C I] (2−1) data. The red contours and yellow dots show the best-fit rotating disk model and the rotation velocity projected along the line of sight, respectively, assuming a constant velocity dispersion (σv = 47 km s−1). The contour levels are at S/N = ( ± 2, 3, 5), and negative contours are shown with dashed gray lines.
Current usage metrics show cumulative count of Article Views (full-text article views including HTML views, PDF and ePub downloads, according to the available data) and Abstracts Views on Vision4Press platform.
Data correspond to usage on the plateform after 2015. The current usage metrics is available 48-96 hours after online publication and is updated daily on week days.
Initial download of the metrics may take a while.