Fig. 12.
Download original image
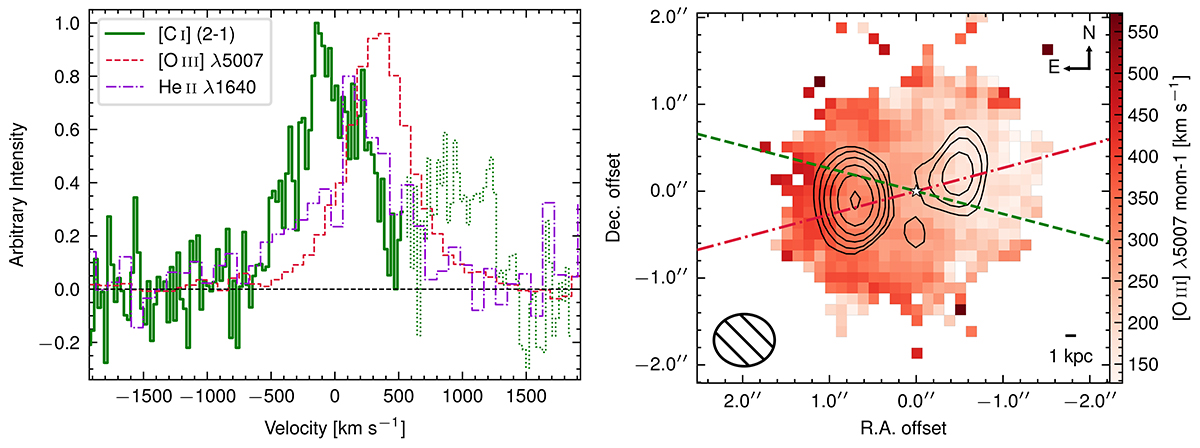
Comparison of the ALMA, VLT/SINFONI, and VLT/X-Shooter data (see also Lelli et al. 2018). Left: [C I] (2−1) (solid green) and [O III] λ5007 (dashed red) line profiles extracted from an aperture with a diameter of 1 arcsec, centered at the kinematic center. The He IIλ1640 (dash-dotted violet) line is adapted from Man et al. (2019). The velocities of [C I] (2−1), [O III] λ5007, and He IIλ1640 are relative to the redshift of [C I] (2−1) line (z = 2.5706 ± 0.0002). The CO (7−6) emission adjacent to [C I] (2−1) is marked with a dotted green line (not shifted in velocity). Right: [O III] velocity field (adapted from Nesvadba et al. 2017; Lelli et al. 2018) overlaid with the radio lobes from ATCA 18 GHz (black contours). The line-of-sight velocities are shown with respect to the redshift of [C I] (2−1). The kinematic major axes of the [C I] (2−1) and [O III] λ5007 lines are shown by the dashed green and the dash-dotted red lines, respectively. The FWHM of the SINFONI point-spread function (0.7 arcsec × 0.6 arcsec) is shown in the bottom left corner. The axis coordinates are relative to the kinematic center (white star).
Current usage metrics show cumulative count of Article Views (full-text article views including HTML views, PDF and ePub downloads, according to the available data) and Abstracts Views on Vision4Press platform.
Data correspond to usage on the plateform after 2015. The current usage metrics is available 48-96 hours after online publication and is updated daily on week days.
Initial download of the metrics may take a while.