Open Access
Fig. 10.
Download original image
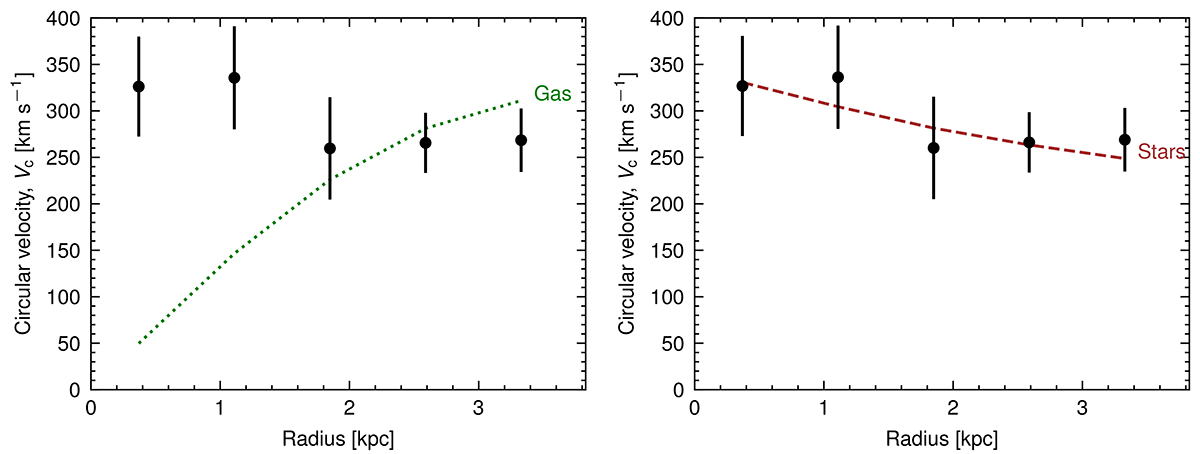
Partial mass models: Gas only (left panel) and stars only (right panel). The black dots with error bars show the observed circular velocities in both panels. The gravitational contributions from gas and stars are shown with a dotted green line and a dashed brown line, respectively.
Current usage metrics show cumulative count of Article Views (full-text article views including HTML views, PDF and ePub downloads, according to the available data) and Abstracts Views on Vision4Press platform.
Data correspond to usage on the plateform after 2015. The current usage metrics is available 48-96 hours after online publication and is updated daily on week days.
Initial download of the metrics may take a while.