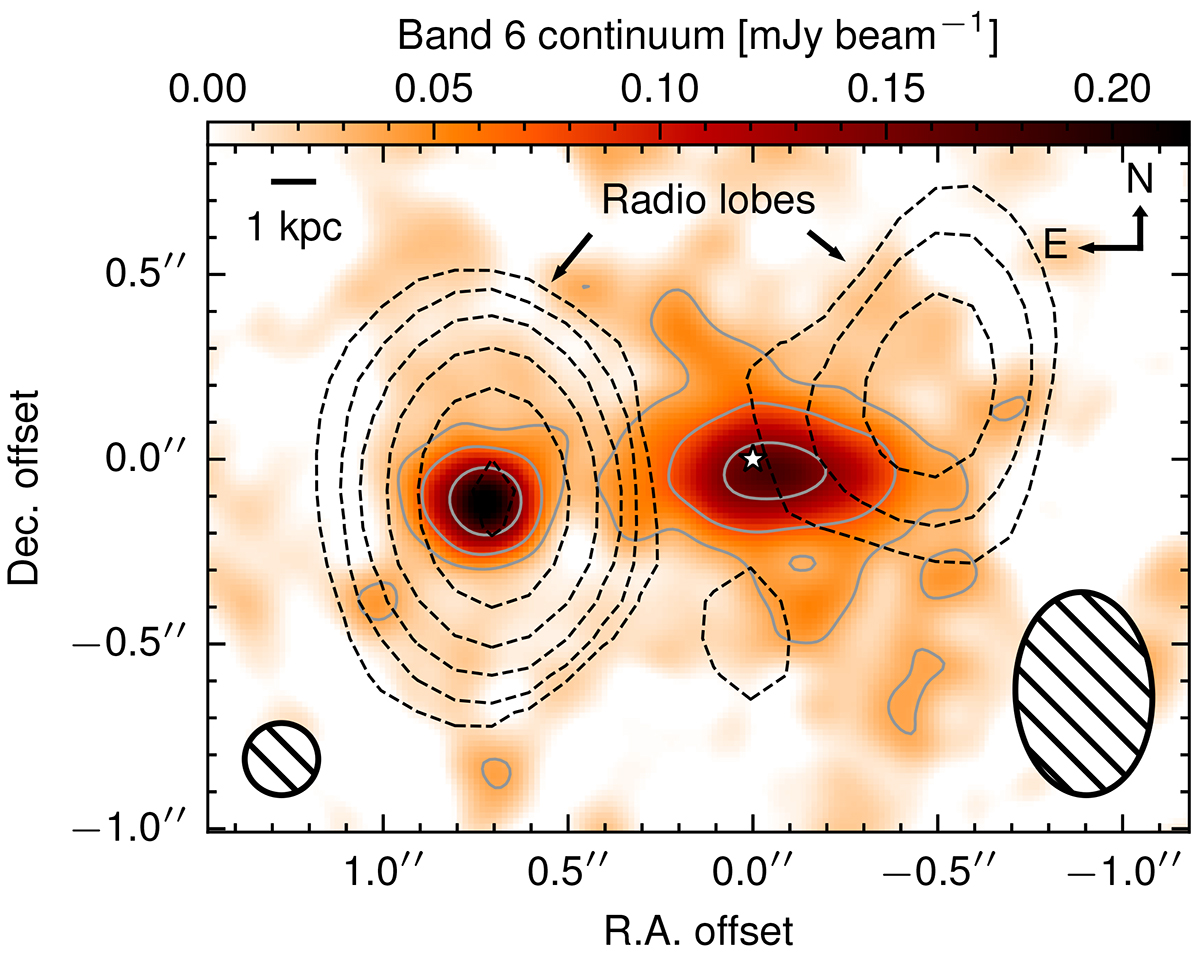
Fig. 1.
Download original image
ALMA band 6 continuum map (background color map and solid gray contours) overlaid with the ATCA 18 GHz continuum map (dashed black contours). The axis coordinates are relative to the kinematic center (white star). The synthesized beams of the ALMA and the ATCA observations are shown in the bottom left and the bottom right corners, respectively. The contours in the ALMA map are at S/N = 3 × (1, 2, 4), and those in the ATCA map are at S/N = 3 × (1, 2, 4, 8, 16, 32).
Current usage metrics show cumulative count of Article Views (full-text article views including HTML views, PDF and ePub downloads, according to the available data) and Abstracts Views on Vision4Press platform.
Data correspond to usage on the plateform after 2015. The current usage metrics is available 48-96 hours after online publication and is updated daily on week days.
Initial download of the metrics may take a while.