Fig. 3
Download original image
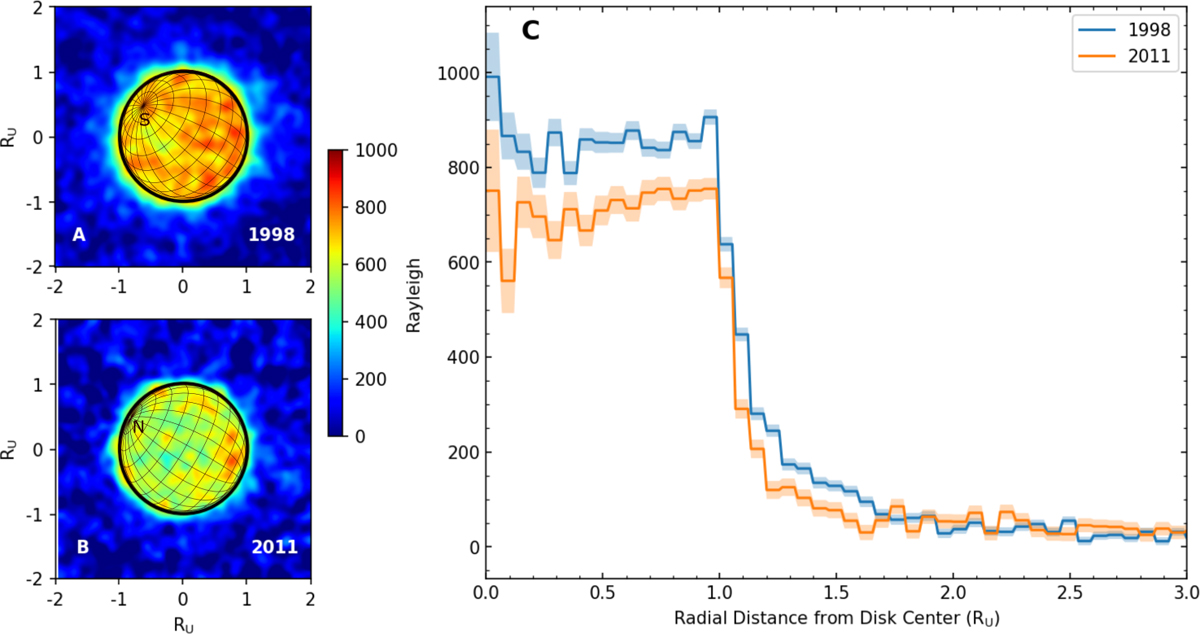
HST observations of Uranus’ Lyα emissions used in this study. Panels A and B: high S/N exposures average images (in native HST detector frame and smoothed for display purposes only). S denotes the position of Uranus’ geometric south pole in all 1998 exposures, while N represents that of north pole in the exposure taken on 31 August 2021. Finally, 0 RU represents the centre of Uranus in the STIS images. Panel C: average radial Lyα profiles.
Current usage metrics show cumulative count of Article Views (full-text article views including HTML views, PDF and ePub downloads, according to the available data) and Abstracts Views on Vision4Press platform.
Data correspond to usage on the plateform after 2015. The current usage metrics is available 48-96 hours after online publication and is updated daily on week days.
Initial download of the metrics may take a while.