Fig. B1
Download original image
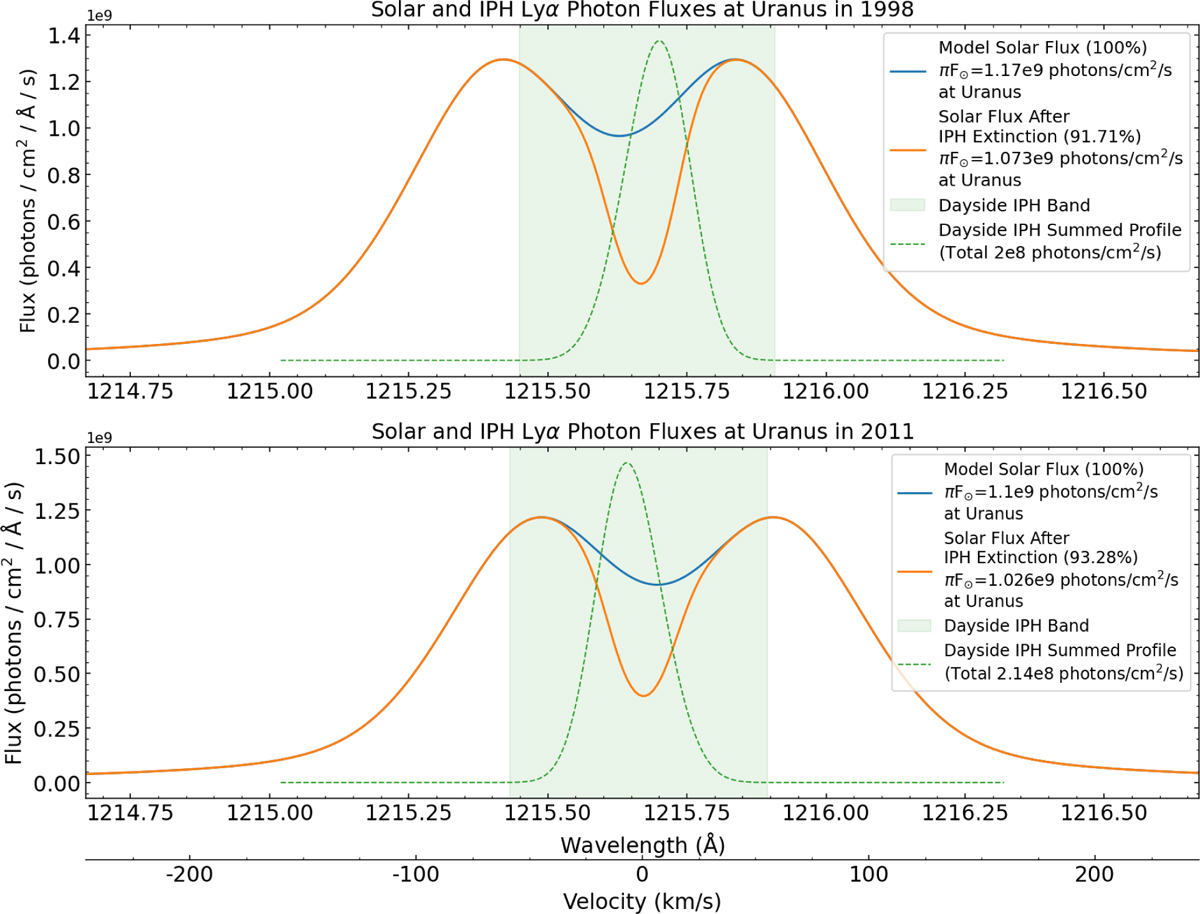
Estimation of Lyα fluxes at Uranus during 1998 and 2011 observations. In both panels, the blue curve shows the unattenuated solar Lyα line at Uranus at the observation epochs, modelled with equal and opposite Gaussians and Lorentzians (see text), while the orange curve shows the solar Lyα line at Uranus after attenuation by IPH between the Sun and Uranus. The green shade shows dayside IPH signal band at Uranus during that epoch. The spectral limits of the bands approximately represent the maximum blue and red shifted wavelengths of dayside IPH Lyα lines. The dashed green profile represents dayside IPH summed line profile.
Current usage metrics show cumulative count of Article Views (full-text article views including HTML views, PDF and ePub downloads, according to the available data) and Abstracts Views on Vision4Press platform.
Data correspond to usage on the plateform after 2015. The current usage metrics is available 48-96 hours after online publication and is updated daily on week days.
Initial download of the metrics may take a while.