Fig. 5
Download original image
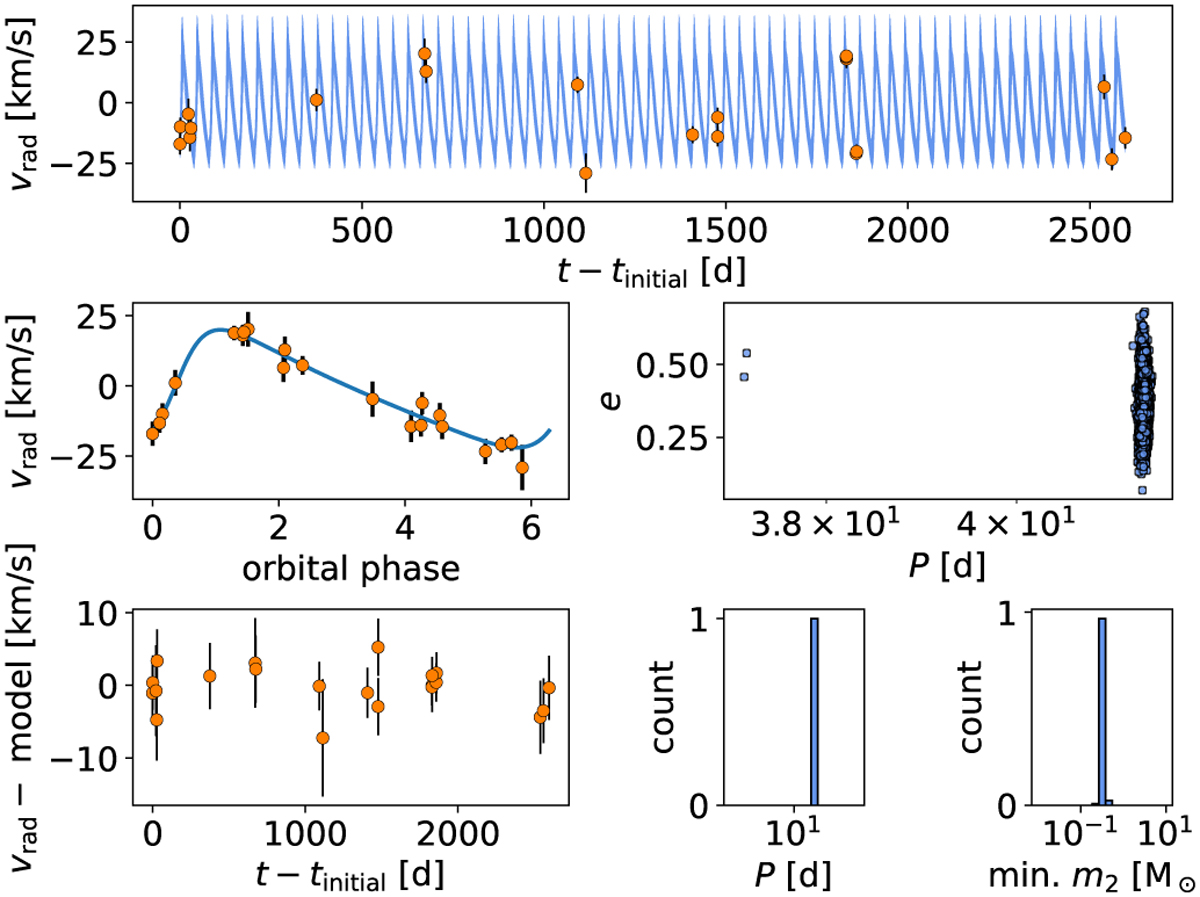
Binary system with a well-constrained unimodal orbit. The upper panel shows the RV time series data (orange markers) and RV orbits computed from the posterior samples (blue lines). The MAP model and phase-folded RVs as well as the residuals from the model are shown in the center and lower left panels. Right panels show the distributions of the posterior samples in period P, eccentricity e and minimum companion mass min. m2.
Current usage metrics show cumulative count of Article Views (full-text article views including HTML views, PDF and ePub downloads, according to the available data) and Abstracts Views on Vision4Press platform.
Data correspond to usage on the plateform after 2015. The current usage metrics is available 48-96 hours after online publication and is updated daily on week days.
Initial download of the metrics may take a while.