Fig. 7.
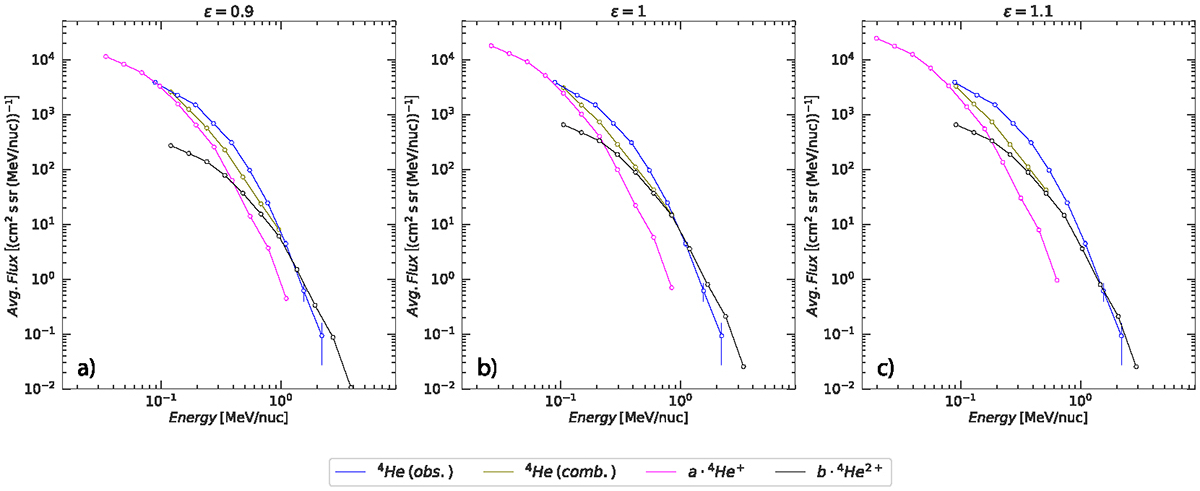
Download original image
Reconstruction of the 4He spectra observed at ACE in the upstream ESP time interval divided into three portions: the pickup ion (He+, magenta); the alpha particle (He2+, black) spectra, made by shifting the rigidity-scaled Fe spectra into energy space using Equation (2), albeit with the appropriate charge and mass values; and the combination of the two, denoted by the olive line the area where the individual spectra overlap. Panels (a)–(c) show the reconstruction using different values of ϵ from Equation (4). The constants a and b are used to alter the relative concentrations of the two particle populations.
Current usage metrics show cumulative count of Article Views (full-text article views including HTML views, PDF and ePub downloads, according to the available data) and Abstracts Views on Vision4Press platform.
Data correspond to usage on the plateform after 2015. The current usage metrics is available 48-96 hours after online publication and is updated daily on week days.
Initial download of the metrics may take a while.